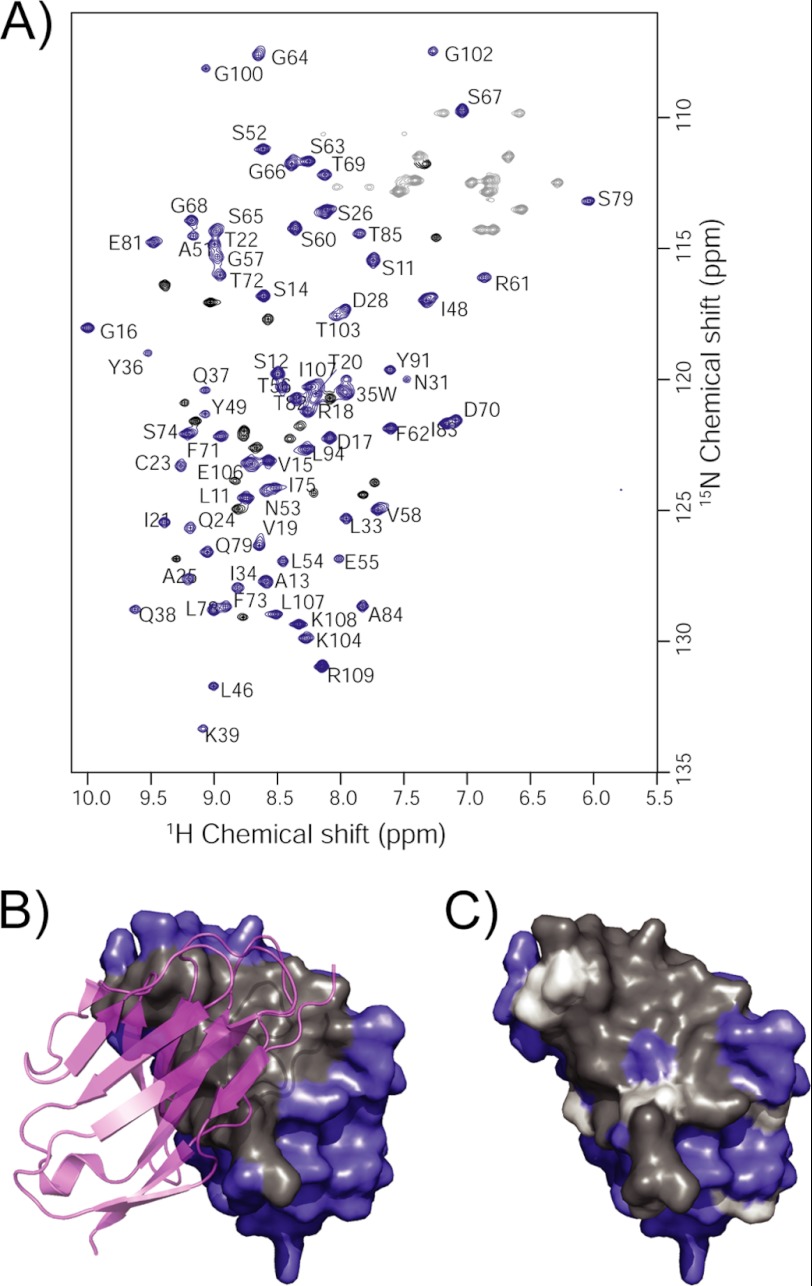
FIGURE 6.
NMR studies of AL-103. A, 15N-1H HSQC spectrum of AL-103, only 93/103 observable backbone amide resonances were detected. Assignments for 73 of these peaks (blue) were completed using the three-dimensional triple-resonance NMR data; the other 20 backbone peaks (black) could not be assigned due to weak or missing signals in the three-dimensional spectra. Side chain NH2 peaks are shown in gray. B, crystal structure of the AL-103 dimer, with one subunit shown as a semi-transparent ribbon. Dimer interface residues are colored gray on the surface of the opposing subunit. C, assigned (blue) and unassigned (gray) residues are highlighted on one subunit of the AL-103 dimer, illustrating the extent to which exchange broadening maps to the dimer interface. Proline residues are highlighted in white.

