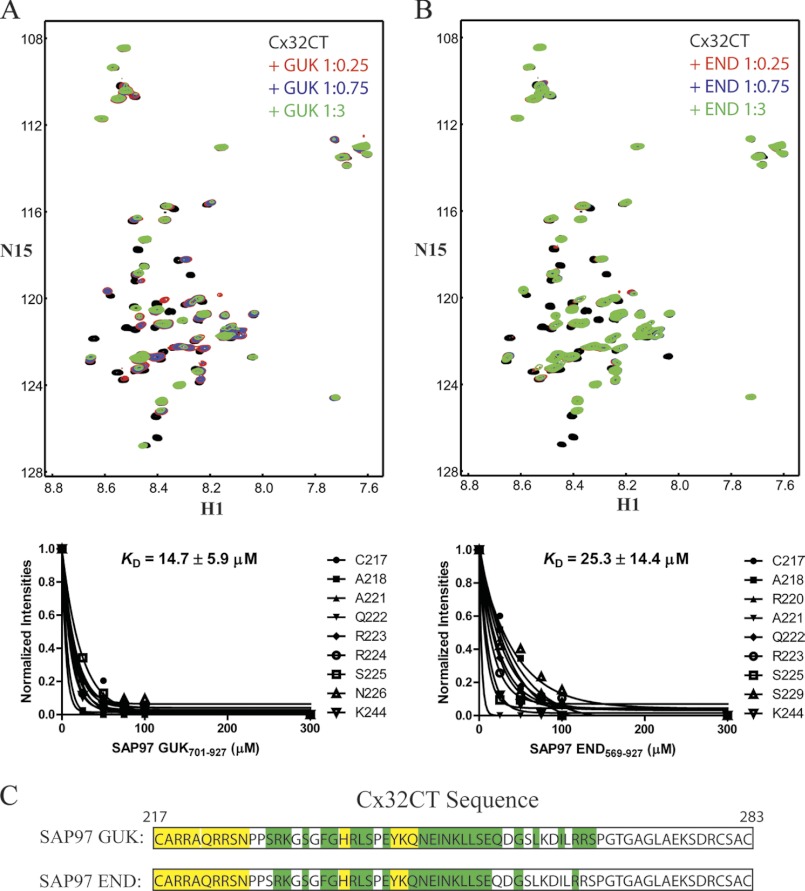
FIGURE 4.
NMR studies characterizing the Cx32CT residue affected upon SAP97 binding. The Cx32CT was titrated with the SAP97 GUK(701–927) (A) or END(569–927) (B) domains. 15N-HSQC spectrum for Cx32CT alone (black) has been overlaid with spectra obtained in the presence of different concentrations of the SAP97 domains GUK(701–927) and END(569–927). The cross-peak color changes according to the concentration ratio (Cx32CT:SAP97 domain 1:0 (black), 1:0.25 (red), 1:0.75 (blue), 1:3 (green)). Titrations of 1:0.5 and 1:1 were also collected and used for calculating the dissociation constant (KD) (lower panels A and B), but were not included for easier visualization of the chemical shift changes. The KD for the Cx32CT/GUK(701–927) and Cx32CT/END(569–927) interaction was estimated by fitting the decrease in signal intensity for the Cx32CT residues Cys217, Ala218, Arg220-Asn226, Ser229, and Lys244 as a function of GUK(701–927) or END(569–927) concentration. C, schematic representation of the residues of Cx32CT affected by the binding of the SAP97 GUK(701–927) and END(569–927) domains. Highlighted in yellow are the residues that were most affected (peaks broaden beyond detection or shift with no overlap at 1:0.25 ratio) and those in green were less affected (shift at 1:0.75 ratio).

