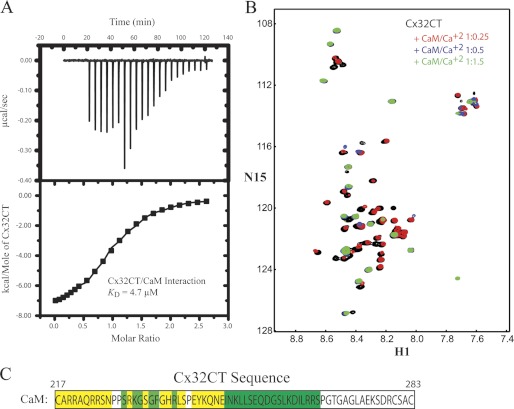
FIGURE 5.
Thermodynamic and structural characterization of the interaction between the Cx32CT and CaM. A, ITC profile of the Cx32CT interaction with CaM. The ITC runs were performed at 37 °C. The upper halves show the original heat production upon injection and the lower show the integrated, dilution-corrected, and normalized peaks. B, 15N-HSQC titration of 15N-Cx32CT with unlabeled CaM in the presence of 5 mm Ca2+. Each titration contained the same concentration of 15N-Cx32CT (100 μm) with different concentrations of the CaM. The cross-peak color changes according to the concentration ratio (Cx32CT:CaM 1:0 (black), 1:0.25 (red), 1:0.5 (blue), 1:1.5 (green)). Titrations of 1:0.75, 1:1, and 1:3 were also collected, but were not included for easier visualization of the chemical shift changes. C, displayed is the amino acid sequence for the Cx32CT and the most affected residues due to titrated CaM have been highlighted in yellow (peaks broaden beyond detection or shift with no overlap at 1:0.25 ratio) and those less affected in green (peaks shift or broaden beyond detection at 1:0.5).

