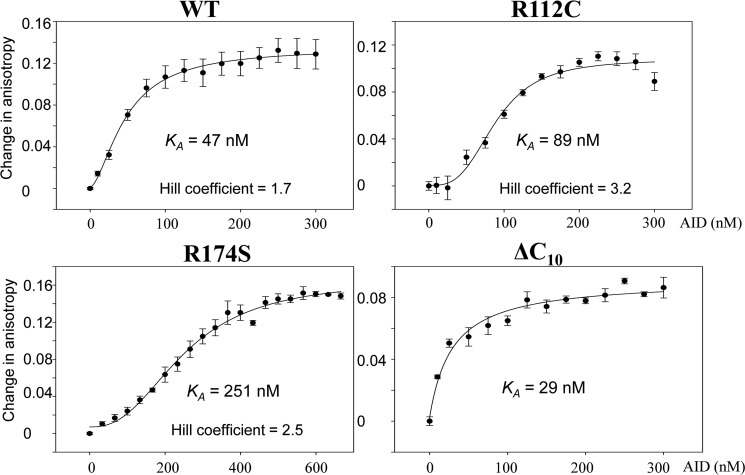
FIGURE 4.
WT and mutant AID binding to ssDNA. AID-ssDNA binding was measured by rotational anisotropy using a fluorescein-labeled 36-nt oligonucleotide substrate. The changes in rotational anisotropy with increasing AID concentrations were fit to either a sigmoidal or hyperbolic binding curve. Values for each data point represent the mean ± S.E. determined from three independent measurements.

