FIGURE 2.
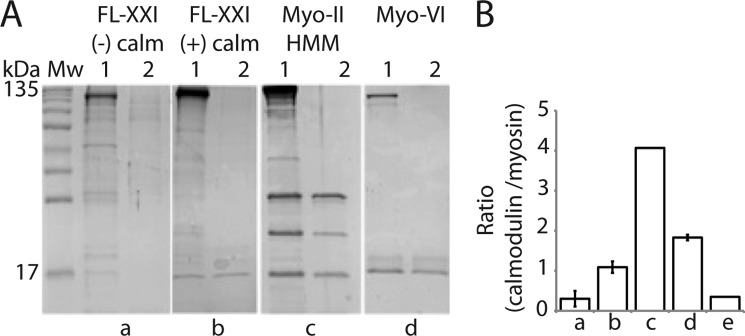
Calmodulin stoichiometry. A, separation of calmodulin from myosin preparations by heat treatment and analysis by SDS-PAGE as described by Coluccio et al. (14). In panels a–d, lane 1 refers to the sample containing the myosin heavy chain and bound calmodulin before heat treatment. Lane 2 refers to the supernatant after heat treatment and subsequent centrifugation at 245,000 × g for 20 min. Gels are representatives of n experiments: sample FL-XXI expressed without calmodulin (n = 2) (a), FL-XXI co-expressed with calmodulin (n = 4) (b), tissue-purified myosin-II heavy meromyosin (HMM) (n = 1) (c), and chicken full-length myosin-VI coexpressed with calmodulin (n = 2) (d). Note the very faint band at 17 kDa consistent with calmodulin in lane a1. This band probably indicates a small amount of endogenous insect cell calmodulin that has been picked up by the expressed Leishmania myosin heavy chains. B, the histogram shows the ratios of myosin heavy chains to calmodulin (mean ± S.D.). The histogram column (e) shows the truncated myosin-XXI construct (aa 1–800) coexpressed with calmodulin (n = 1).

