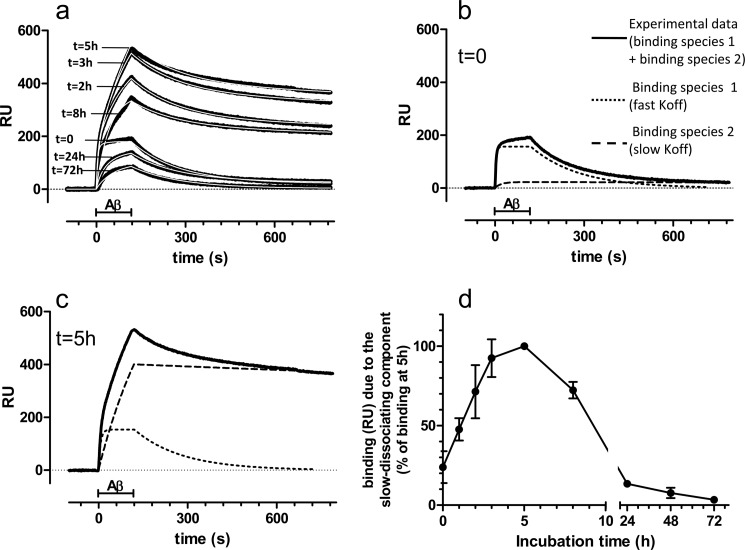
FIGURE 1.
SPR studies. a, synthetic Aβ1–42 (100 μm) was incubated at 25 °C, and samples were taken at different times (from 0 to 72 h), diluted to 1 μm in PBS, and injected over immobilized 4G8 for 2 min (bar), followed by 11 min of dissociation. The figure shows the sensorgrams (time course of the SPR signal expressed in resonance units, RU) obtained in a representative experiment (black lines). Fitting the sensorgrams (white lines) required a model assuming the presence of two binding species with different dissociation rates. b, experimental sensorgram obtained injecting the freshly prepared solution (t = 0, continuous line) is shown together with the theoretical sensorgrams corresponding to the quickly dissociating binding species (dotted lines) and the slowly dissociating binding species (dashed lines). The experimental sensorgram is mainly accounted for by the quickly dissociating species, which bind to 4G8 with a KD of 75 ± 10 nm (n = 5). c, experimental and theoretical sensorgrams obtained injecting the solutions incubated for 5 h. The lines are as in b. Note the increase of the signal caused by the slowly dissociating species (see the complete sets of data in supplemental Fig. S1). d, time course of the slowly dissociating component. Each point is the mean ± S.D. of three or four independent experiments, presented as a percentage of the signal found after 5 h of incubation.

