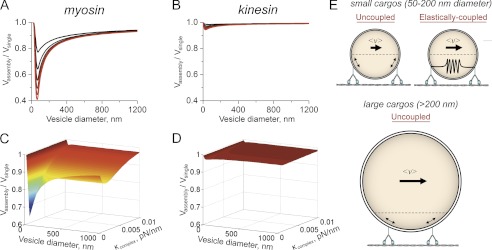
FIGURE 4.
Comparison of cargo velocities driven by two myosin and two kinesin motors. A and B, ratio of the average two-myoVa (A) and two-kinesin velocities (B) (Vassembly) to a single motor velocity (Vsingle) plotted as a function of the diameter of a vesicular cargo. Curves shown on both plots were calculated for complexes with the same physical characteristics, but where the unloaded, microscopic motor filament binding rate (kon0) was varied from 0.025 1/s (black curve) to 0.15 1/s (red curve) in increments of 0.025 1/s. C and D, three-dimensional plots of the velocities ratio from A and B as function of vesicle diameter and over a range of values for κcomplex at intermediate extension distances. E, schematic depicting the dependence of two-myoV velocity on cargo size. The dashed line on the cargo denotes the region on the cargo surface where both motors can bind without introducing cargo deformations. Local elastic coupling between the motors, which also modulates cargo velocity when cargos are small, is also depicted by the spring connecting the motors.

