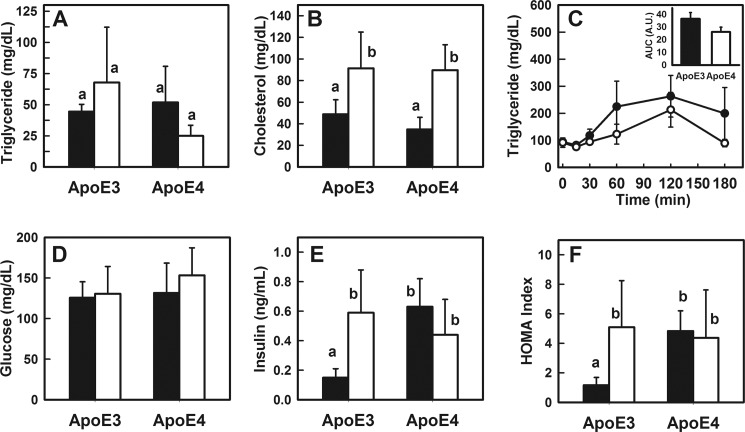
FIGURE 2.
Blood chemistry of APOE3 and APOE4 mice. Male APOE3 and APOE4 mice were fed either a chow diet (filled bars) or a Western-type diet (open bars) for 4 weeks. A shows fasting plasma triglyceride levels; B shows fasting cholesterol levels in APOE3 and APOE4 mice. C shows postprandial triglyceride levels in chow-fed APOE3 (solid symbols) and APOE4 (open symbols) mice after feeding a bolus lipid-rich meal (15 μl of olive oil/g body weight), and the inset shows area under the curve (AUC) analysis indicating no significant differences (p = 0.15) between the two groups. D and E show fasting glucose and insulin levels in APOE3 and APOE4 mice, respectively, and F shows the homeostasis model assessment index of insulin resistance calculated from these data. All data represent mean ± S.D. from six mice in each group. Bars with different letters in each graph are significantly different at p < 0.01.

