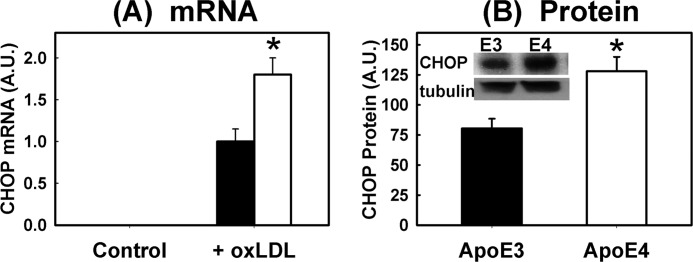
FIGURE 7.
Elevated CHOP expression in APOE4 macrophages. A shows CHOP mRNA expression levels relative to cyclophilin mRNA in APOE3 (filled bars) and APOE4 (open bars) peritoneal macrophages incubated in the absence (control) or presence of 100 μg/ml oxLDL. Note that no CHOP mRNA was detected in samples incubated under control conditions. B shows CHOP protein levels in APOE3 (solid bar) and APOE4 (open bar) macrophages after incubation with oxLDL. The inset shows representative Western blot of CHOP protein with tubulin as loading control. The data are reported as mean ± S.E. from three separate experiments. * denotes difference from the APOE3 macrophages at p < 0.05.

