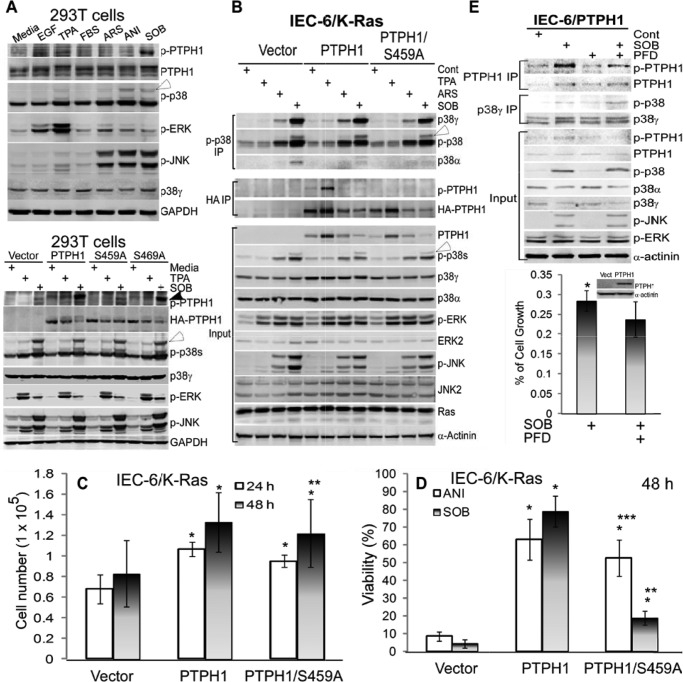
FIGURE 3.
PTPH1/Ser-459 phosphorylation is increased in response to both mitogenic and stress stimuli, p38γ regulates stress signaling to stimulate p-PTPH1/Ser-459 expression by a microenvironment-dependent mechanism, and PTPH1 requires Ser-459 to inhibit SOB but not ANI-induced cell death. A, cells (293T) were treated with different reagents for 1 h (EGF at 20 ng/ml, TPA at 200 ng/ml, FBS at 10%, ARS at 100 μm, ANI at 100 μg/ml, and SOB at 0.5 m), which were then analyzed by WB. Bottom panel, PTPH1 and its mutants were transiently expressed in 293T cells for 48 h, followed by treatment with TPA or SOB as above, and effects of expressed PTPH1 and its mutants on p-p38γ and other p-MAPKs expression were examined by WB. Closed and open arrowhead indicate endogenous p-PTPH1 and p-p38γ, respectively. B, IEC-6/K-Ras cells stably expressed with indicated plasmids were treated with stimuli as in A, which were analyzed by IP and WB (open arrowhead, p-p38γ). C, IEC-6/K-Ras cells expressed with indicated plasmids were plated at the same density, and cell growth was determined by counting viable cells at 24 and 48 h (error bars, S.D.; n = 3; *, p < 0.05; and **, p > 0.05 versus vector; recalculated from the control groups of D and supplemental Fig. S3A). D, indicated IEC-6/K-Ras cells were pulse-treated with SOB or ANI as in A, and cell viability was determined 48 h later by the trypan blue exclusion assay (17) (n = 3; *, p < 0.05 versus vector, **, p < 0.05 versus PTPH1, and ***, p > 0.05 versus PTPH1, with the viability of all control groups without ANI/SOB treatment being >95%). Similar results were obtained at 24 h (supplemental Fig. S3A), and associated WB results are shown in supplemental Fig. S3C. E, IEC-6 cells stably expressed with PTPH1 were preincubated with and without PFD for 6 h (50 μg/ml), followed by the pulse exposure to SOB as in A, and resultant effects on p-PTPH1/p-p38γ expression were analyzed by IP/WB (top) and on cell growth by the CyQuent NF cell proliferation kit (35). Results (bottom, n = 3; *, p < 0.05) are expressed as relative to the solvent control, with cells in every group for each of experiments plated in 6 wells with the mean absorbance from 6 wells considered as one experiment.

