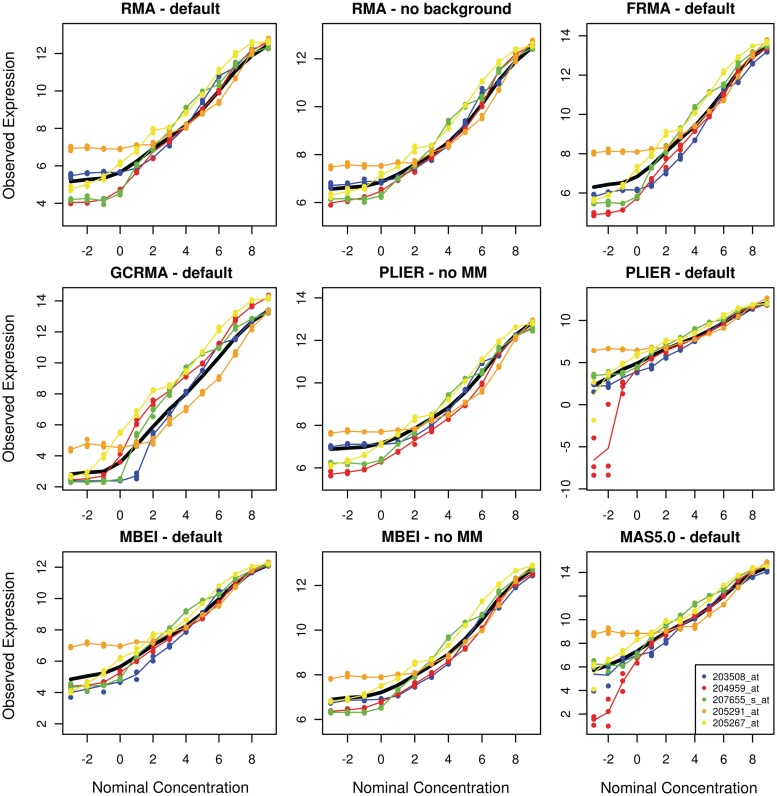
Figure 1:
Plots of the signal detect curves for five probe sets (listed at bottom right) from the Affymetrix HGU133a spike-in dataset using nine different preprocessing algorithms. Technical replicates within a nominal concentration are represented by solid circles. The solid black line shows the average signal detect curve across all probe sets for each preprocessing method.

