
Figure 3.
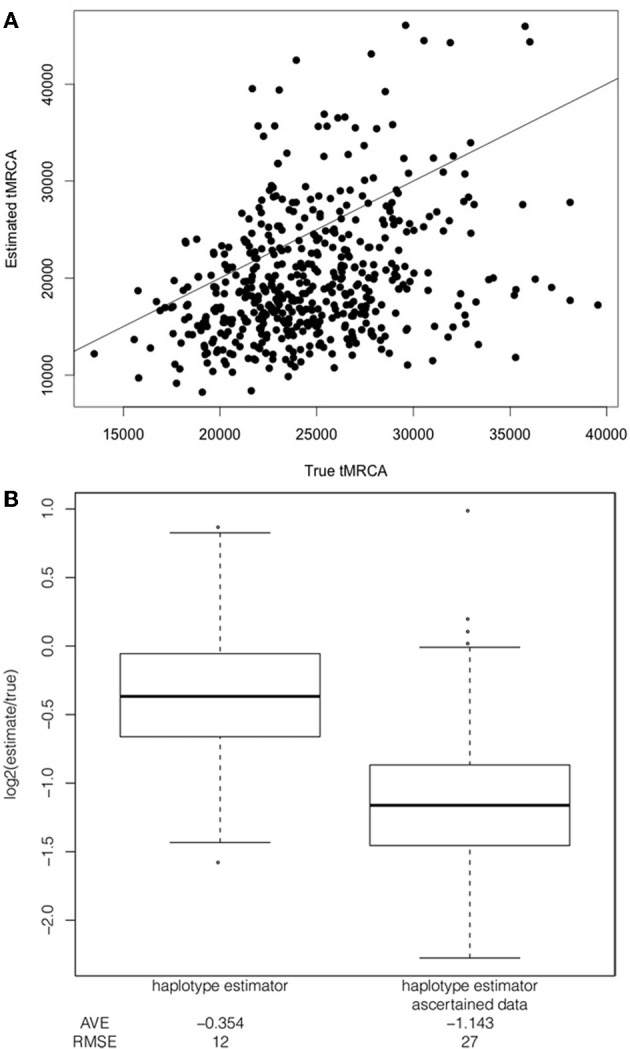
Comparison of bias in estimator applied to full sequence data and ascertained data. Comparison of the true to estimated tMRCA (A) Example of direct comparison between true tMRCA and estimated tMRCA when applied to full sequence data simulated under a constant population size, uniform recombination rate, a selection coefficient of 1%, additive dominance and with the selected allele at a frequency of 50% in the population and the sample, with line x = y for reference. (B) Boxplot of log2 ratio of the tMRCA estimate to the true tMRCA for the two estimators (applied to full sequence data and ascertained data) under a constant population size, uniform recombination rate, a selection coefficient of 1%, additive dominance and with the selected allele at a frequency of 50% in the population and the sample. A value of 1.0 or −1.0 corresponds to a two-fold over or under-estimate, respectively. The root mean squared error (RMSE) and average log2 ratio (AVE) is included below each boxplot.