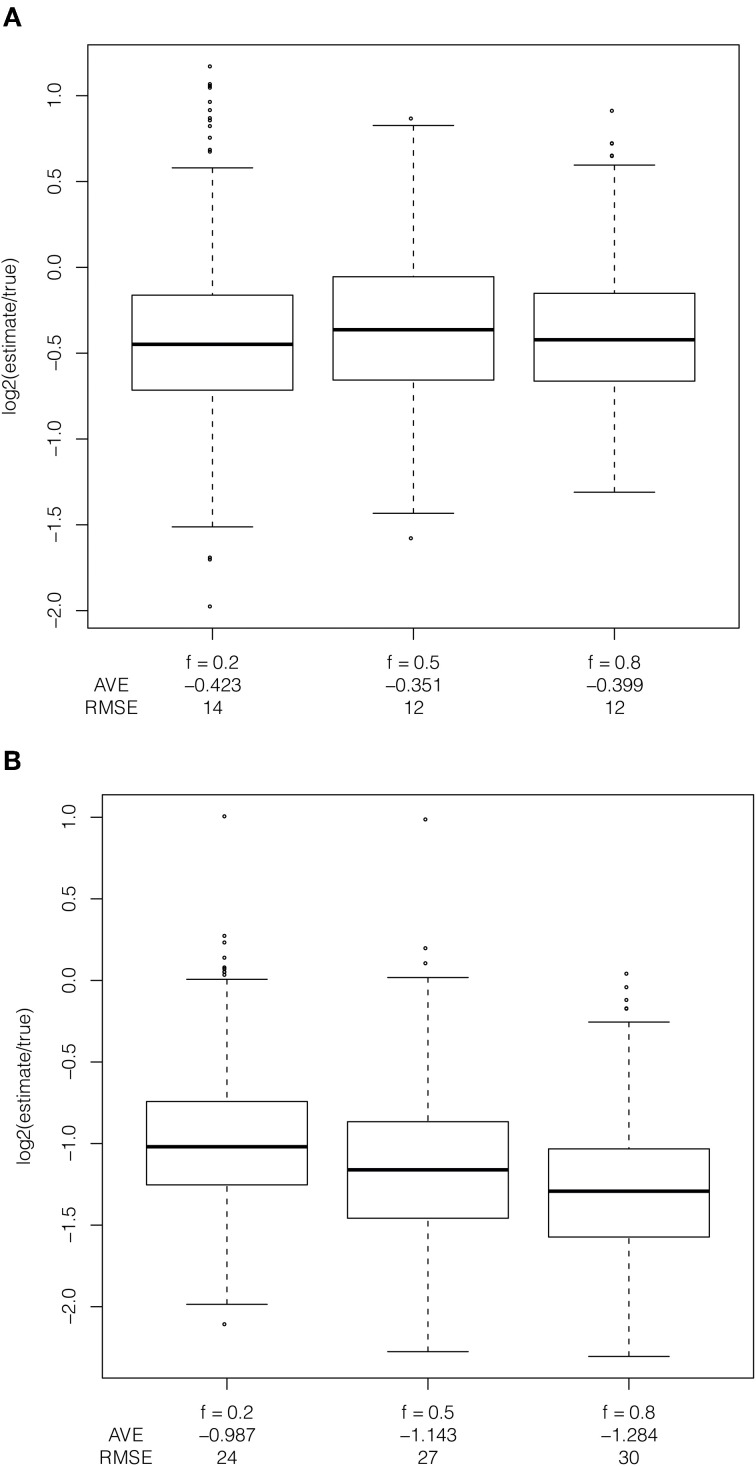
Figure 5.
Effect of frequency of the selected allele in the population. Comparison of bias in estimator due to frequency of the selected allele applied to (A) full resequence data and (B) ascertained data with constant population size, uniform recombination rate, selection coefficient of 1%, additive dominance and with the selected allele at a frequency of 20%, 50%, and 80% in the population and 50% in the sample.

