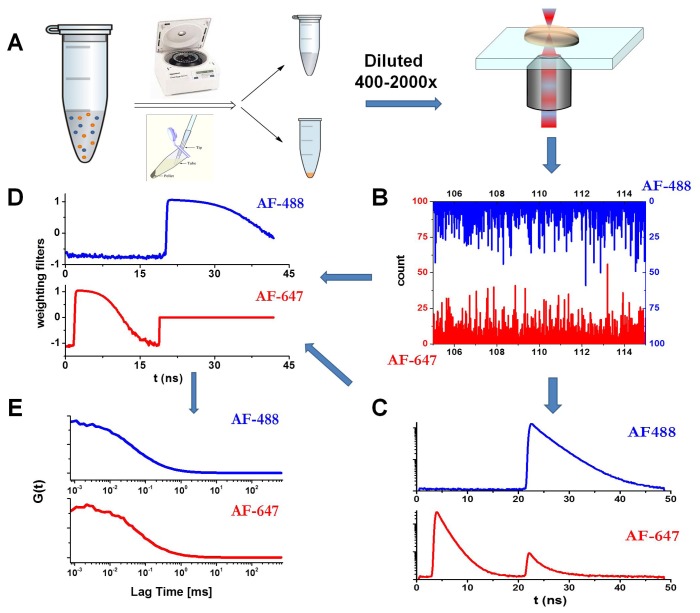
Figure 1.
Schematics of the Pulsed Interleaved Excitation-Fluorescence Lifetime Correlation Spectroscopy (PIE-FLCS) measurement. (A) Protocol for the PIE-FLCS measurements. (B) Example of fluorescence traces in the AF488 and AF647 channels. (C) TTTR methodology allows independent reconstruction and selection of fluorescence decay traces of AF488- (detector 1) and AF647-labeled (detector 2) proteins. (D) Weighting filters for correlation. (E) Lifetime-filtered autocorrelation curves in both channels.

