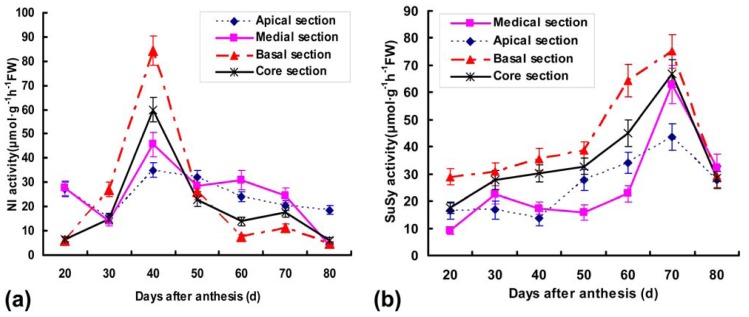
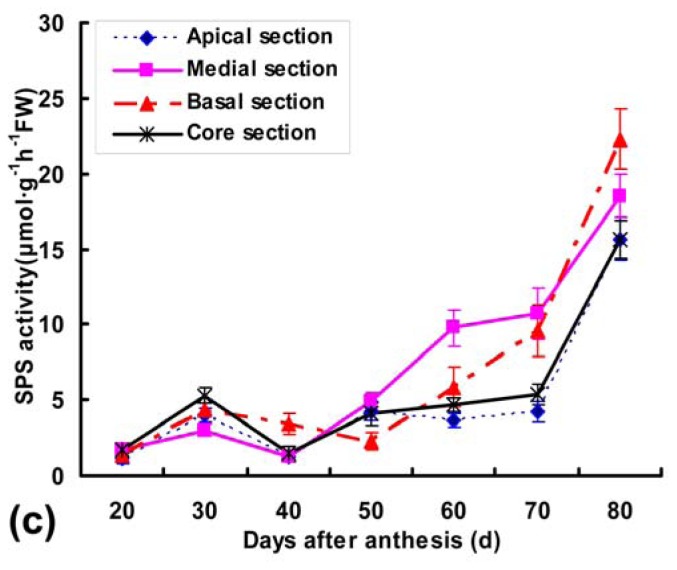
Figure 6.
Activity profiles of (a) NI; (b) SuSy; (c) SPS in crude protein extracts of different fruit sections during pineapple development. Activities were expressed as μmol product synthesized g−1 h−1 FW. Each point is the mean of three determinations, and vertical bars are representative of ± S.E. (n = 3).


