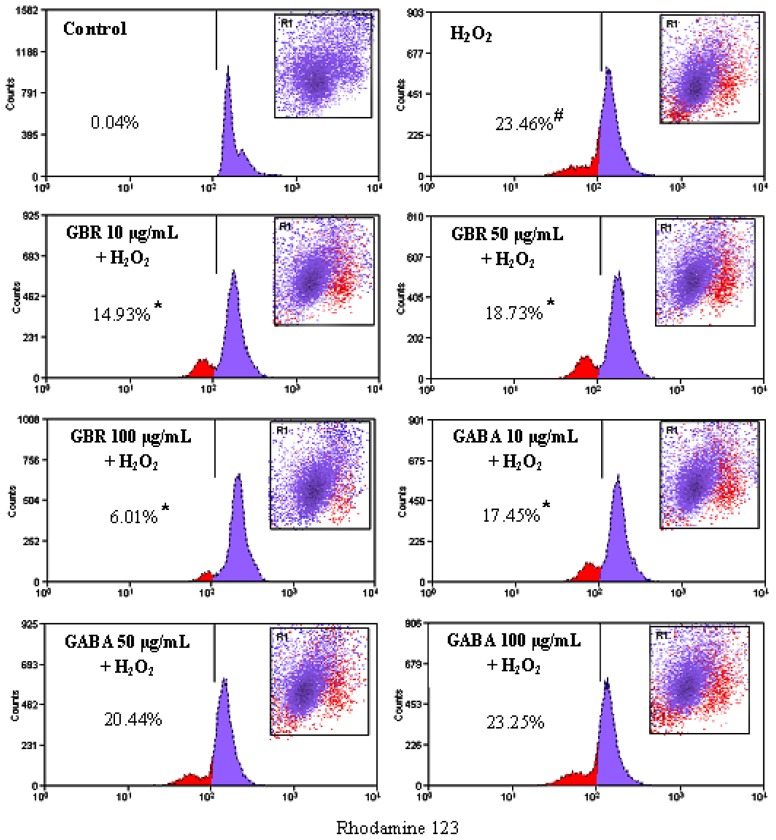
Figure 3.
Effects of GBR and GABA on H2O2-induced reduction of mitochondrial membrane potential. Cells were pre-treated with 10, 50 and 100 μg/mL of GBR and GABA, respectively followed by 250 μM H2O2 challenge for 24 h. After incubation, cells were stained with Rhodamine 123 and analyzed by flow cytometer. The reduced fluorescence of Rhodamine 123 was determined as the reduced mitochondrial membrane potential. Results are the mean ± SD in triplicates. * p < 0.01 versus H2O2, # p < 0.01 versus control.

