Figure 3.
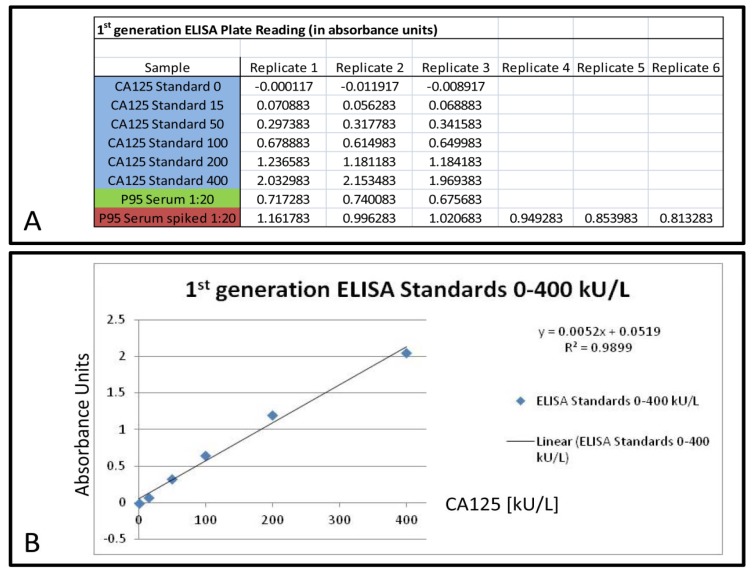
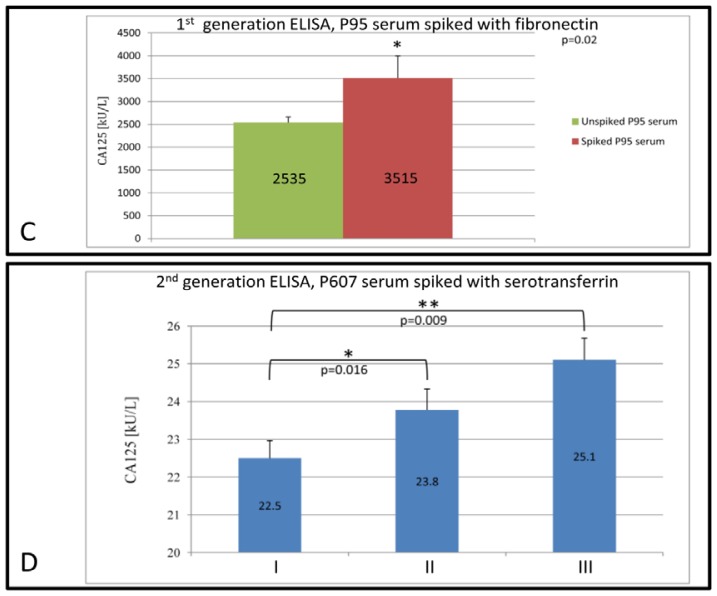
(A) Measured values in absorbance units for CA125 standards (0–400 kU/L) (blue), 1:20 diluted P95 serum (green) and 1:20 diluted P95 serum spiked with 80 μg fibronectin (red). The values obtained from P95 serum and spiked P95 serum were used for the Mann-Whitney U test; (B) Standard curve obtained by plotting the detected absorbance units against the kU/L of the CA125 standards. This curve was used to calculate the CA125 concentration of the used samples (C) CA125 concentration measured by a first generation ELISA (M11-like). Green: P95 serum, red: P95 serum spiked with 80 μg fibronectin. The increase in reading is statistically significant (* p < 0.05). Error bars indicate standard deviation of measured values within the respective sample; (D) CA125 concentrations measured by a clinically used second generation ELISA. I: 500 μL P607 serum + 100 μL H2O; II: 500 μL P607 serum + 100 μL apo-serotransferrin (100 mg/mL); III: 500 μL P607 serum + 100 μL holo-serotransferrin (100 mg/mL). The increase in the reading for CA125 is statistically significant (*) between apo-serotransferrin (II) and unspiked serum (I) and statistically highly significant (** p < 0.01) between holo-serotransferrin (III) and unspiked serum (I). Error bars indicate the standard deviation of the measured values in the respective sample.


