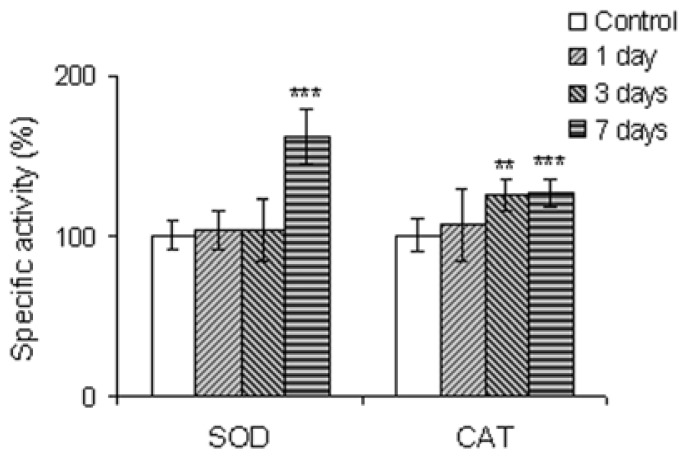
Figure 3.
SOD and CAT relative specific values in kidney cells of Carassius auratus gibelio IP injected with silicon-based QDs up to seven days of exposure. Data are calculated as means ± SD (n = 6 in each group at each time point) and expressed as % from time point controls; * p ≤ 0.05, ** p ≤ 0.01, *** p ≤ 0.001.

