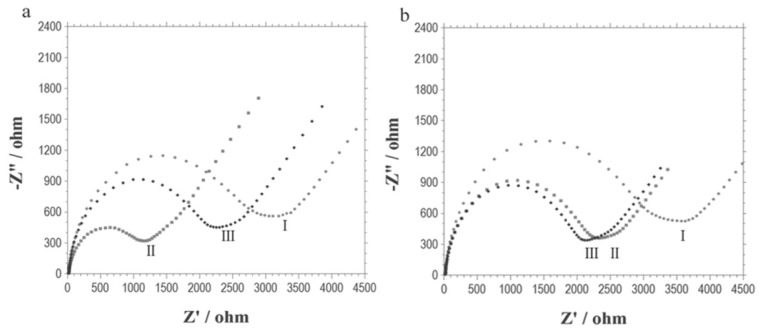
Figure 1.
Electrochemical impedance spectra (Nyquist plots) of the DNA modified electrode (I) before and (II) after its incubation with (a) 22Rv1 cells which were treated with both 100 μM iRGD and 50 μM doxorubicin, or (b) 50 μM doxorubicin. Curve (III) is the case of further treatment with cell lysis buffer; Test solution: 1 M KNO3 containing 5 mM Fe(CN)63−/4−. Biasing potential: 0.222 V. Amplitude: 5 mV. Frequency range: 0.1 Hz to 100 kHz.

