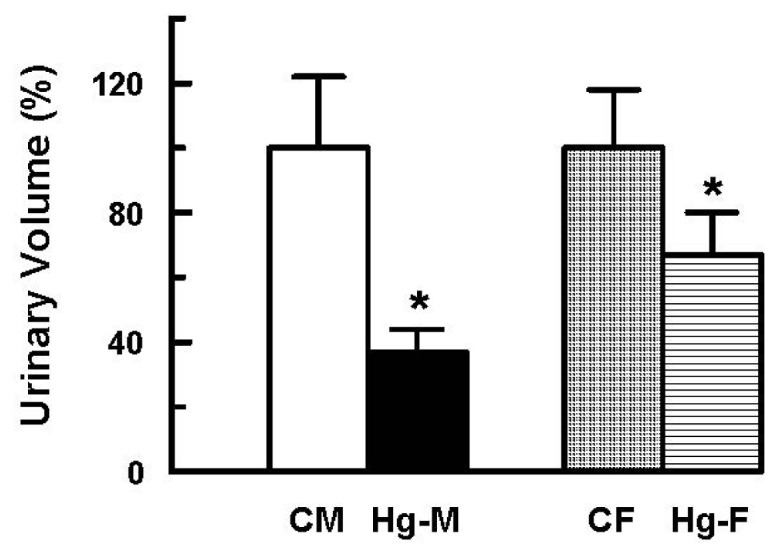
Figure 3.

Effect of HgCl2 (4 mg/kg of body weight, i.p.) on the urinary volume in male and female rats 18 h after treatment. Each column represents the mean ± SEM from experiments carried out in four animals for each experimental group. * p < 0.05 vs. respective control. The mean of both control male and female levels were set as 100%. CM: Control Males; Hg-M: Hg-treated Males; CF: Control Females; Hg-F: Hg-treated Females.
