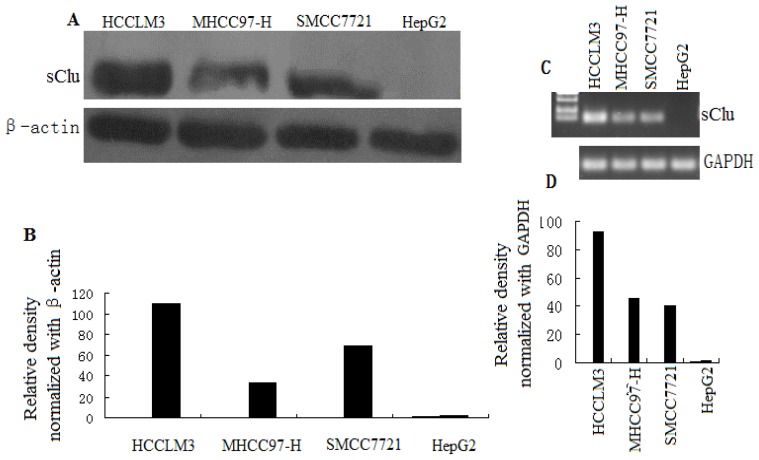
Figure 1.
sCLU expression in HCC cells. (A) Whole cell lysates were prepared, and Western blot analysis was done to evaluate sCLU protein levels in SMCC7721, HepG2, HCCLM3, and MHCC97-H cells. Blots were reprobed with β-actin antibody to verify equal loading of proteins; (B) Histogram represents the density of bands in A normalized with β-actin; (C) Representative PCR of reverse-transcribed total RNA extracted from SMCC7721, HepG2, HCCLM3, and MHCC97-H cells. To normalize CLU gene expression, GAPDH cDNA was also amplified in the same samples; (D) Histogram represents density of bands in B normalized with GAPDH.

