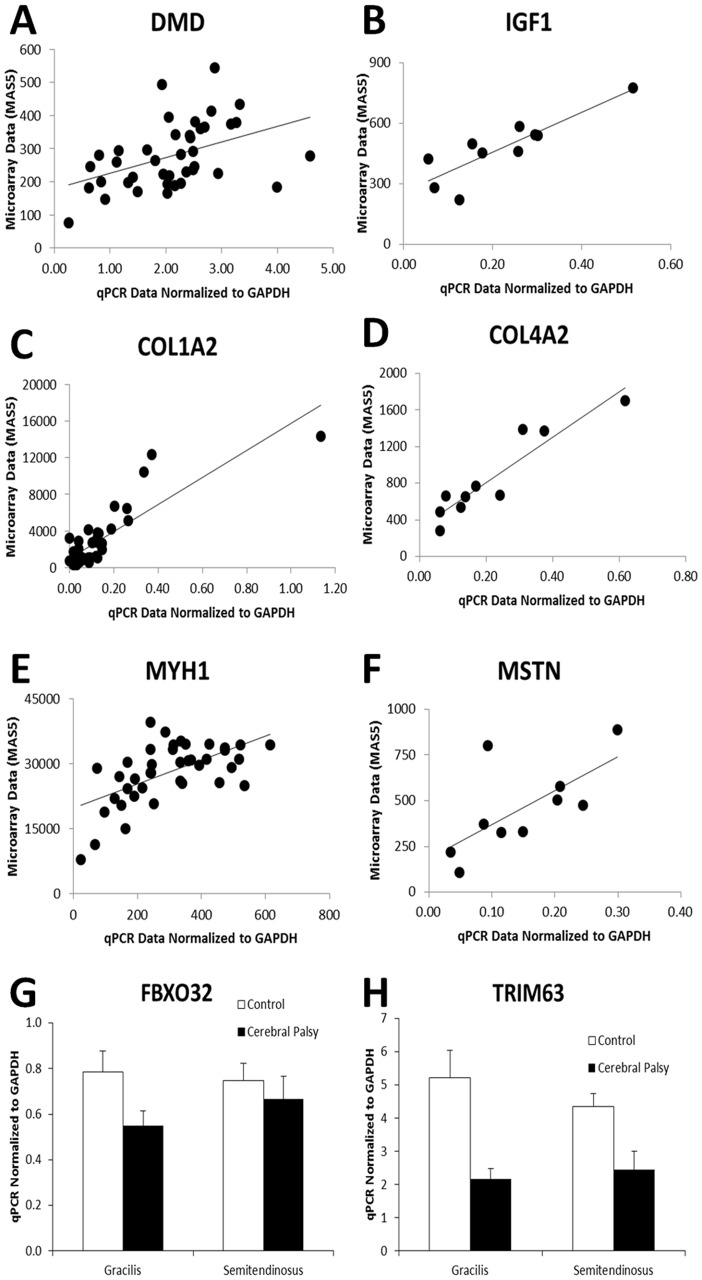
Figure 2. Comparison of quantitative real-time PCR data to microarray data.
The microarray data from MAS5 summarization algorithm is used. Each gene in A–F has a significant correlation (p<0.05). (G) atrogin-1 (FBXO32) and (H) MURF-1 (TRIM63) are quantified based on disease state and muscle as they are not present on the microarray.

