
Figure 3.
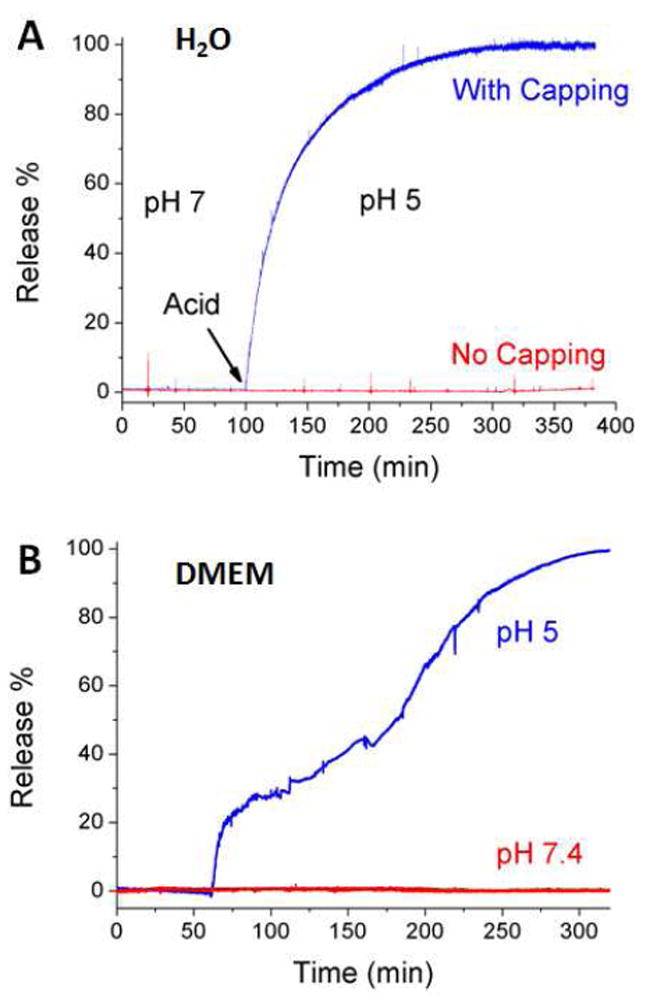
A) Plot of the release of Hoechst 33342 from PSiNPs in aqueous solution. Acid was added to adjust the solution pH. The red line shows the release profile from the control experiment where no cyclodextrin was used for capping. B) The release profile generated in tissue culture medium DMEM. The blue line shows the functioning of the nanovalve when acid was added at 60 min. The red line shows the absence of leakage when the pH is unchanged.