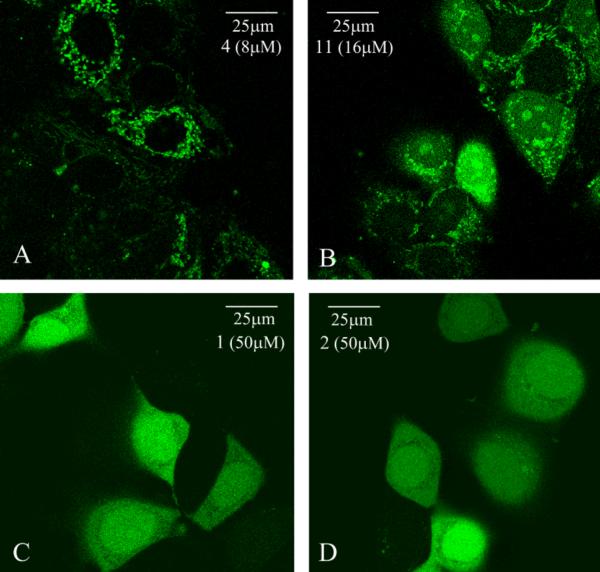
Fig. 4. Intracellular distributions of construct 4, 11, 1 and 2--the live-cell confocal imaging.
MCF 7 cells were incubated at 37°C with 8μM of 4 (A)9, 16μM of 11 (B), 50μM of 1 (C) and 2 (D) in 10% FBS media for 1h. Different concentrations were used to achieve similar image brightness. Cells were washed thoroughly and imaged on Leica confocal laser microscope (×63 oil lens)

