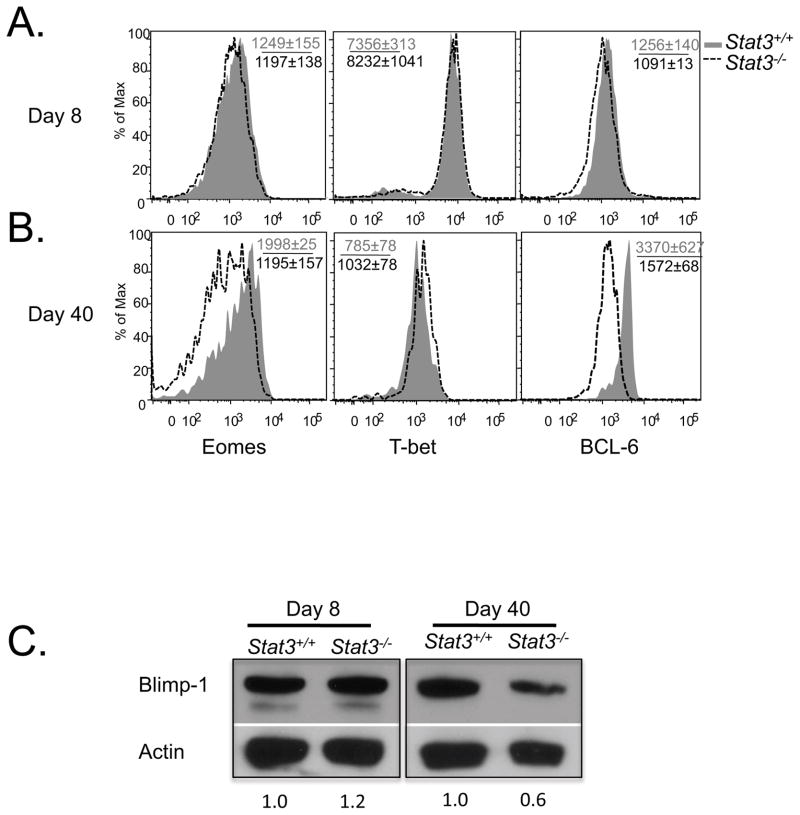
Figure 5. Stat3−/− CD8+ T cells have reduced expression of Eomes and BCL-6.
(A and B) Histogram plots showing the expression of Eomes, T-bet and BCL-6 in DbGP33–41 tetramer+ Stat3+/+ (shaded) and Stat3−/− (dashed line) CD8+ T cells at days 8 (A) and 40 (B) post infection. (C) Western blot shows the amount of Blimp-1 and Actin (loading control) in P14 CD8+ T cells isolated at days 8 and 40 p.i. by FACS. Numbers below the graph indicate the normalized abundance of Blimp-1 measured by densitometry.

