FIGURE 2:
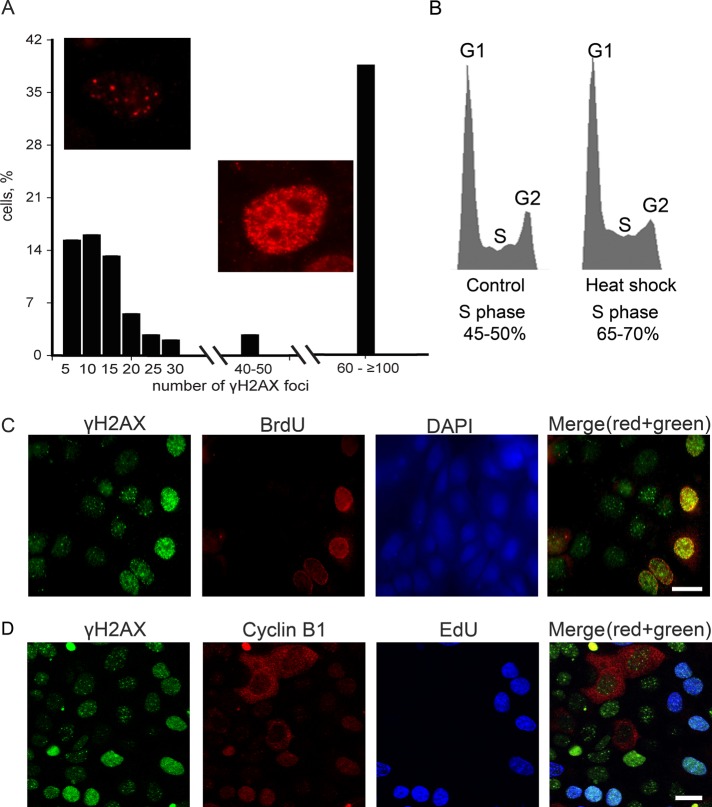
Patterns of HS-induced γH2AX foci are dependent on the cell cycle phase. (A) The percentage of HS-treated (45.5°C, 30 min) mcf-7 cells possessing different numbers of γH2AX foci. More than 200 individual cells immunostained with anti-γH2AX antibody were analyzed. (B) Flow cytofluorometric analysis of the cell cycle distributions of the control (untreated) and heat-stressed cells. Aliquots of asynchronously proliferating control mcf-7 cells and cells that were heat-shocked for 30 min at 45.5°C were stained with propidium iodide and analyzed by flow cytometry. The relative DNA content of 500,000 cells was plotted against the cell number in each histogram. Calculated percentages of S-phase cells in each case are indicated below the corresponding histograms. (C) Human mcf-7 cells were pulse-labeled with BrdU (100 μM, 20 min), heat-stressed (45.5°C, 30 min), and double-immunostained against γH2AX and BrdU. The DNA was stained with DAPI. A superimposition of the green and red channels is shown in the last section (Merge). Scale bar: 20 μm. (D) Human mcf-7 cells were pulse-labeled with EdU (10 μM, 30 min), heat-stressed (45.5°C, 30 min), and immunostained against γH2AX and cyclin B1. EdU was revealed by Click Chemistry. A superimposition of the green, red, and blue channels is shown in the last section (Merge). Scale bar: 20 μm.

