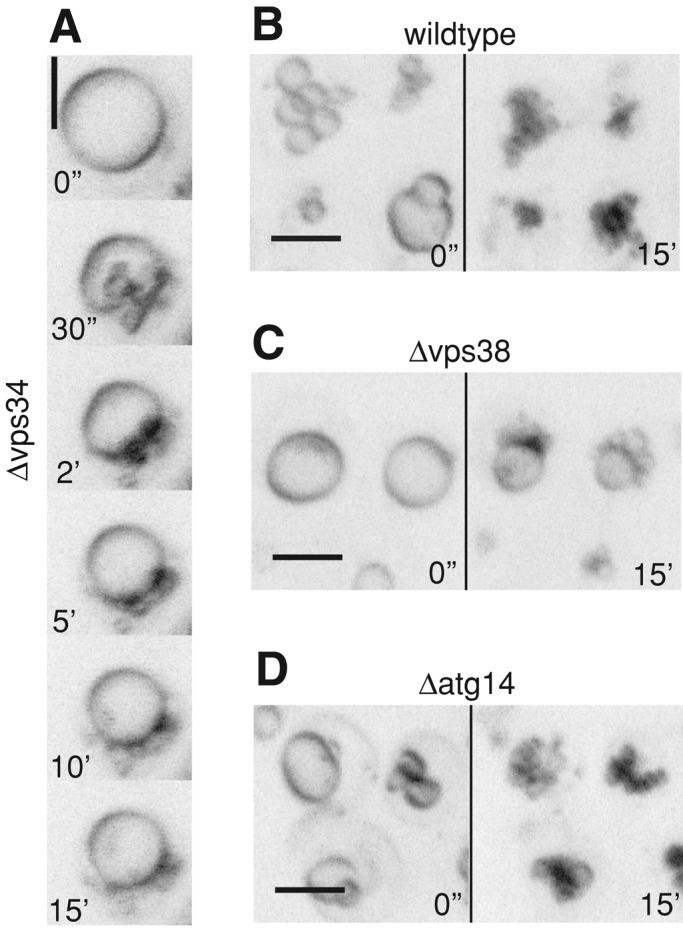
FIGURE 7:

Influence of mutations in different PI 3-kinase complex I and II subunits. Cells were stained with FM4-64 and imaged at the indicated times after salt addition. Pictures are maximum-intensity projections of five z-sections with 0.5-μm spacing. (A) Δvps34, (B) wild type, (C) Δvps38, (D) Δatg14.
