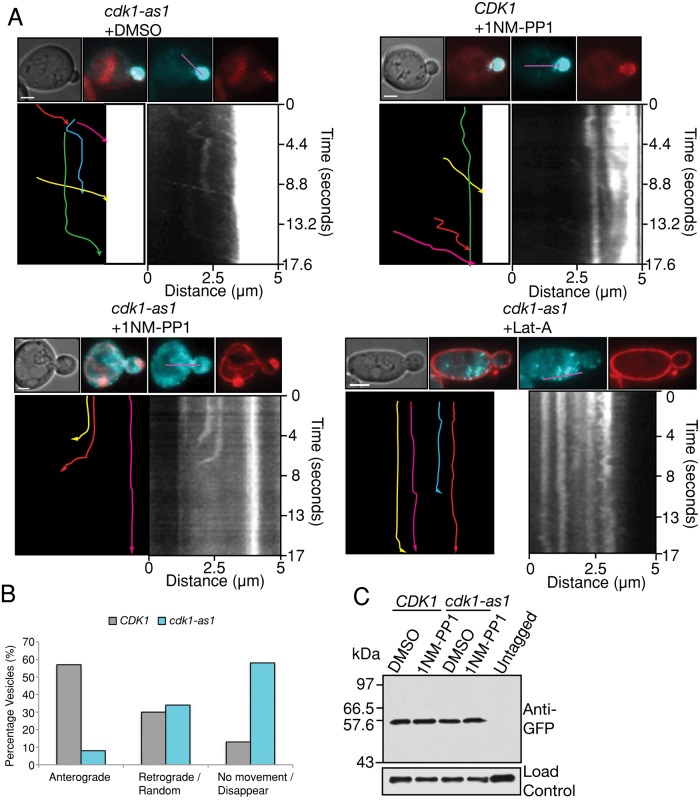
FIGURE 5:
Cdk1 inhibition results in aberrant targeting of post-Golgi vesicles. (A) Cells of the indicated genotypes were treated with 1NM-PP1 or Lat-A for 1 h and pulse chased with FM4-64 to label the vacuole. From 80 to 100 images were then acquired at 220-ms intervals and stacked vertically to generate kymographs. In each set, shown at the top are a differential interference contrast image, merged images of GFP-Sec4 (cyan) and FM4-64 (red), and the individual images used to generate the merge. The longitudinal line used to generate kymographs is shown in purple. Lower right, the resulting kymograph; lower left, a tracing of the kymograph in which each colored line represents the trajectory of a different GFP-Sec4 particle, with the arrowhead showing the direction of movement. Scale bar, 2 μm. (B) Quantitation of vesicle behavior. n = 282 vesicles for CDK1 and n = 671 vesicles for cdk1-as1. (C) Levels of GFP-Sec4 after 1 h of treatment with 1NM-PP1 or DMSO. Nap1 was used as a loading control.

