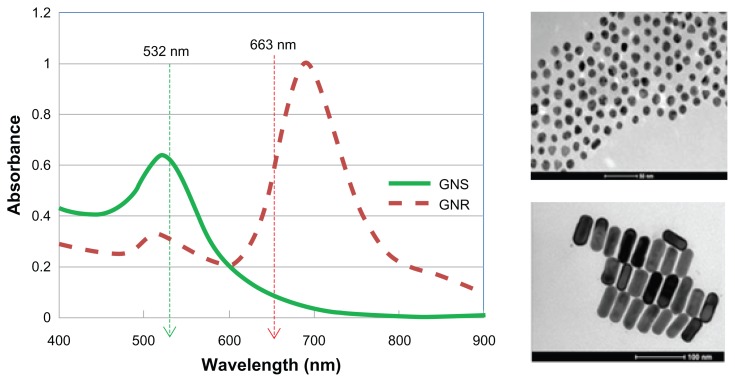
Figure 2.
Left: Absorbance spectra of gold nanospheres (green) and gold nanorods (dashed red).
Notes: The wavelengths of the lasers are shown by the arrows. Right: transmission electron microscopy image of 30 nm gold nanospheres (upper figure, scale bar 100 nm) and 25 nm × 65 nm gold nanorods (lower figure, scale bar 100 nm).

