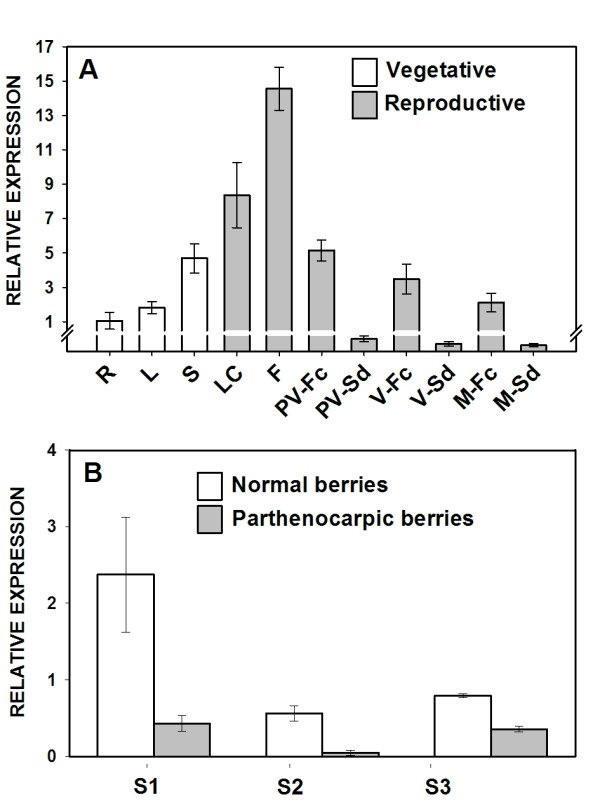
Figure 6.

Gene expression analysis of VvZIP3 in grapevine tissues. (A) Expression analysis of VvZIP3 in R (roots); L (leafs); S (stems); LC (little clusters); F (flowers); PV-Fc (pre-veraison fruit complete); PV-Sd (pre-veraison seeds); V-Fc (whole veraison fruit); V-Sd (veraison seeds); M-Fc (whole mature fruit); M-Sd (mature seeds). Expression in root samples was adjusted to 1 relative unit. Relative expression values of PV-Sd, V-Sd and M-Sd are 0.039, 0.024 and 0.019, respectively. Data represent means ± SD (n = 3). (B) Expression analysis of VvZIP3 in normal and parthenocarpic berries at the pre-veraison stage during three growing seasons (S1, S2 and S3). qPCR analyses of VvZIP3 expression was normalized against the expression level of VvGAPDH. Data represent means ± SD (n = 3).
