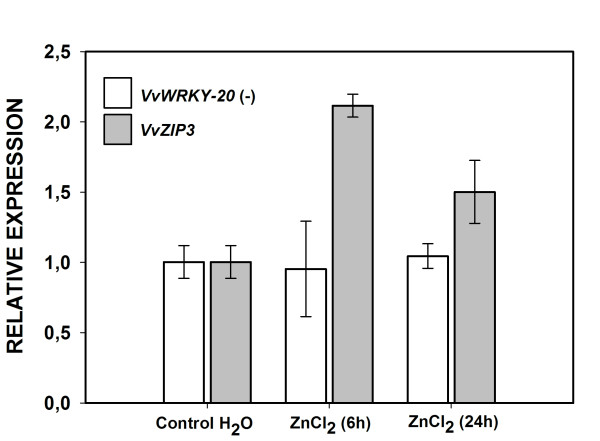
Figure 8.
VvZIP3response under zinc treatment. Expression analysis of VvZIP3 in pre-veraison berries under Zn treatment (2 mM ZnCl2) at 6 and 24 hours. Expression in non-treated (H2O) pre-veraison berries samples for VvZIP3 and VvWRKY-20 (negative control), was adjusted to 1 relative unit. qPCR analyses of VvZIP3 and VvWRKY-20 expression was normalized against the expression level of VvGAPDH. Data represent means ± SD (n = 3).

