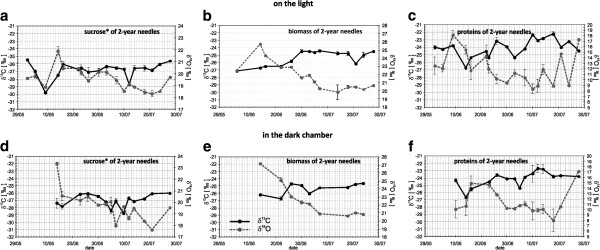
Figure 6.
The courses of δ13C (black lines) and δ18O (dotted gray lines) of sucrose* (a,d), biomass (b,e) and proteins (c,f) from the light (upper panel) and dark (lower panel) chambers during the growth season 2006. *Water soluble organic fraction consisted of ≥97 % sucrose. Data is shown as mean values ± SD (n ≥ 3)

