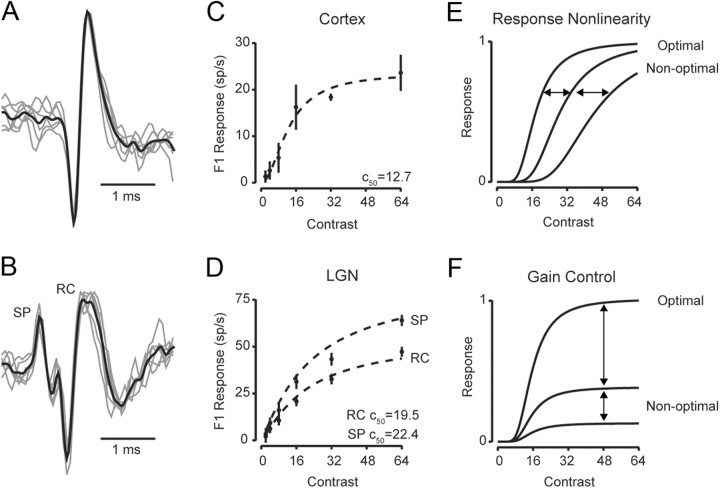
Figure 1.
Contrast response curves along the visual pathway. A, Example extracellular traces from a simple cell in V1. B, Example extracellular traces from an LGN relay cell (marked RC) and the s-potential (marked SP) that preceded the LGN relay cell action potential. (C, D) Contrast response functions are plotted based on the F1 amplitude from the cortical simple cell (C) and the s-potential and LGN relay cells (D). Dashed lines indicate fits using Equation 1. Two different models could account for response saturation: (E) In the response nonlinearity model, saturation occurs at the same response amplitude whether the stimulus is optimal or not. Instead the C50 systematically changes with different spatial stimuli; F, In the gain control model, saturation occurs at the same contrast for different stimuli. Instead the maximum response depends on whether the stimulus is optimal.

