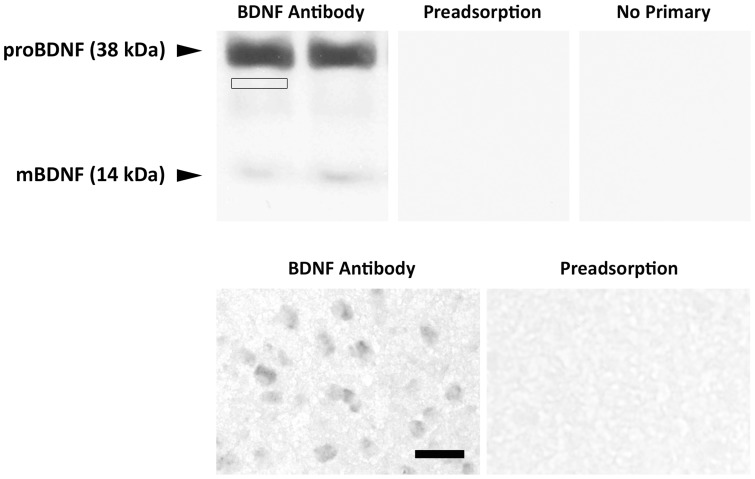
Figure 2. BDNF antibody specificity.
Top: Western blot analyses used total protein (30 µg) extracted from the whole telencephalon of two 25-day-old male zebra finches. The left image shows two bands (38 kDa proBDNF and 14 kDa mature mBDNF) recognized by BDNF primary antibody. The small box immediately below the proBDNF band indicates an example of where the background optical density would be quantified. The middle and right images document the absence of these bands on separate blots preadsorbed with 20-fold excess of the antigen and with the primary antibody omitted, respectively. Bottom: Immunohistochemistry showing distinct BDNF+ cells in RA with the primary antibody and a complete absence of labeling in neighboring section exposed to the antibody following preadsorption with 10-fold excess peptide. Scale bar = 30 µm for both photographs.

