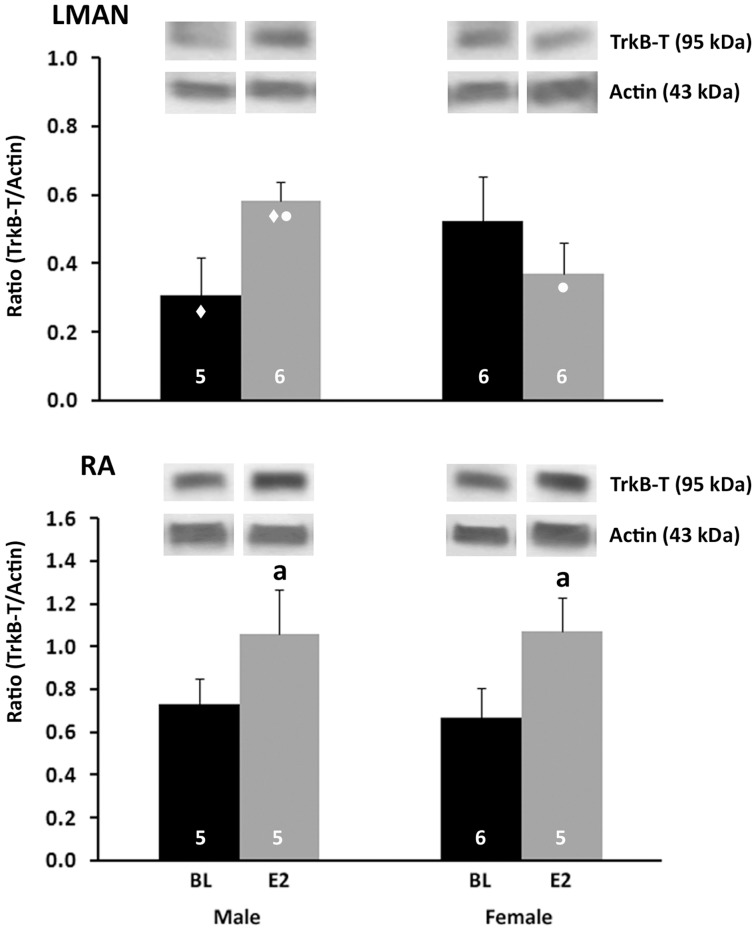
Figure 4. Quantification of TrkB-T protein.
Data and representative bands from Western blots analyses of LMAN (top) and RA (bottom) punches are depicted. The ratio of TrkB-T/actin was calculated from mean optical densities of bands representing these proteins in each individual. Values indicate means+one standard error. Symbols represent trends as follows: ♦ = TrkB-T is greater in E2-treated than control males, p = 0.053; • = In E2-treated birds, TrkB-T is decreased in females compared with males; p = 0.052. The letter ‘a’ indicates a significant main effect of treatment. Sample sizes are indicated within the bars for each group. Representative bands for each protein from the LMAN and RA of each group are shown above the histograms.

