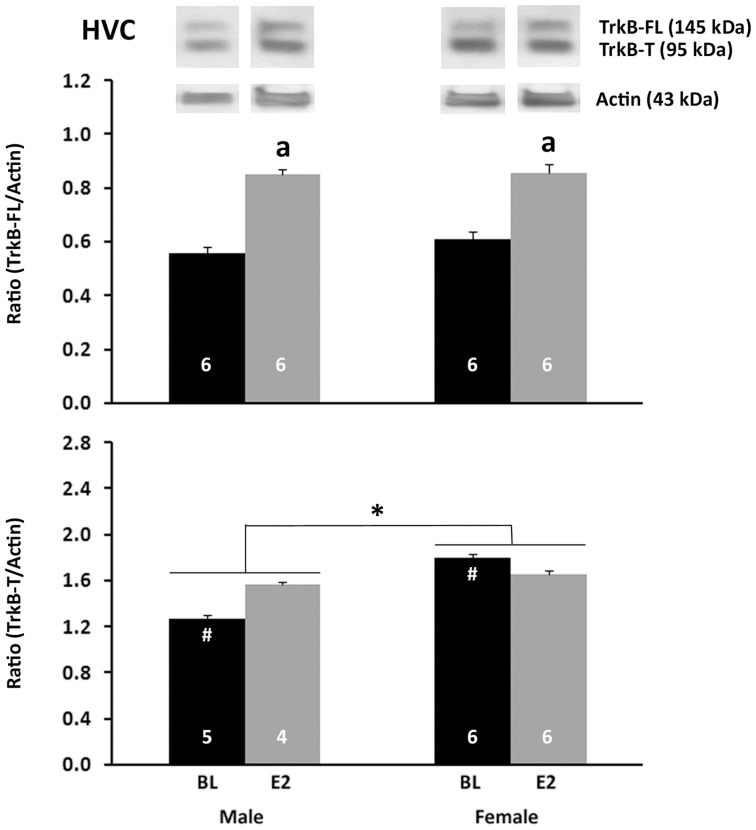
Figure 5. Western blot analyses of TrkB proteins in punches of HVC.
The full length receptor (TrkB-FL) is shown on the top, and the truncated form (TrkB-T) on the bottom. The ratio of each of these proteins relative to actin was calculated from mean optical densities for each individual. Values indicate means+one standard error. Symbols indicate significant effects as follows: a = main effect of treatment; * = main effect of sex; # = Control female>control male. Sample sizes are indicated in the bars. Representative bands for each protein from are shown above the histograms.

