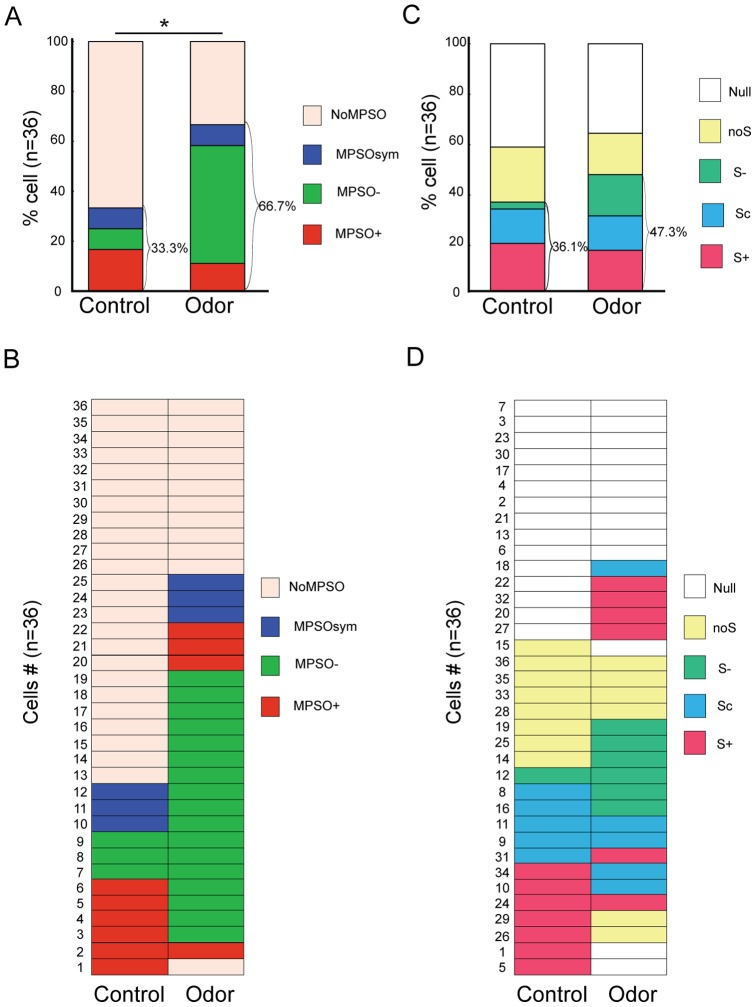
Figure 2. Effects of odor stimulation on membrane potential slow oscillations (MPSOs) and respiration-related discharge patterns.
A) The percentages of MPSO types before (Control) and during odor stimulation (Odor) (n = 36). The MPSO types are indicated by colors as follows: the positive membrane potential slow oscillation (MPSO+) is in red, the negative membrane potential slow oscillation (MPSO-) is in green, the symmetric membrane potential slow oscillation (MPSOsym) is in blue, and no oscillating signal (NoMPSO) is in beige. According to the χ2 statistical test, *p<0.05 between the control and odor period (χ2 (1, 72) = 6.97). B) Synthetic view of the MPSO types in the entire population of recorded cells before (Control) and during odor stimulation (Odor) (n = 36). Each line corresponds to the same cell before and during odor stimulation. The different MPSO types are indicated by the same colors as in panel A. C) The percentages of respiration-related discharge patterns before (Control) and during odor stimulation (Odor) (n = 36). The types of respiration-related patterns are indicated by colors as follows: the excitatory-simple-synchronized pattern (S+) is in red, the complex synchronized pattern (Sc) is in blue, the suppressive-simple-synchronized pattern (S-) is in green, the non-synchronized pattern (NoS) is in yellow, and null activity (Null) is in white. D) Synthetic view of a respiration-related discharge pattern in the entire population of recorded cells before (Control) and during odor stimulation (Odor) (n = 36). Each line corresponds to the discharge activity pattern of an individual cell before and during the odor stimulation. The depicted cells are the same as those that are presented in panel B. The different types of discharge patterns are indicated by the same colors as in panel C.

