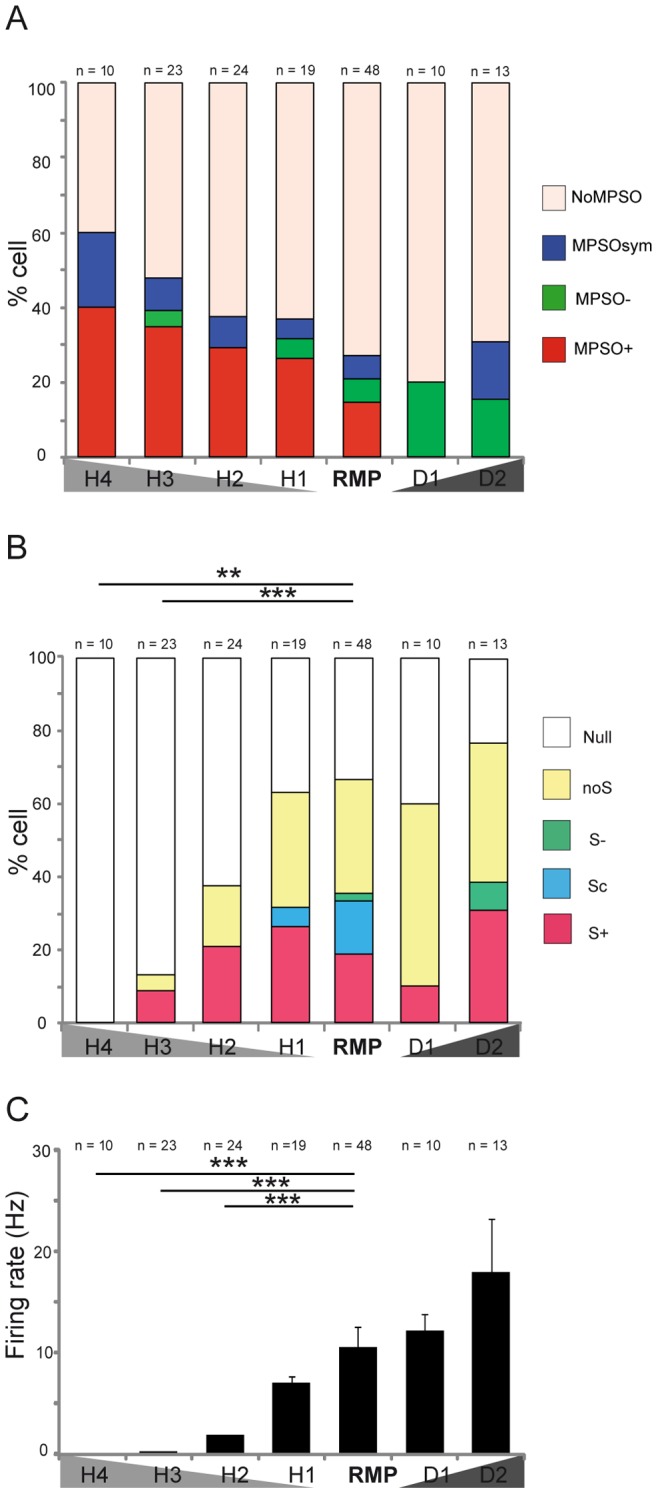
Figure 5. Influence of intracellular excitability state on membrane potential slow oscillations and discharge activities.

A) Percentages of membrane potential slow oscillation types at different excitability levels. As defined in the Materials and Methods section, H1, H2, H3 and H4 are hyperpolarized states. RMP: resting membrane potential; D1 and D2: the two depolarized states. The number of examined cells at each excitability level is indicated at the top of each bar. The membrane potential slow oscillation types are indicated by color as follows: red indicates a positive membrane potential slow oscillation (MPSO+), green indicates a negative membrane potential slow oscillation (MPSO-), blue indicates a symmetric membrane potential slow oscillation (MPSOsym) and beige indicates the percentage of cells without oscillation (NoMPSO). B) Percentages of respiration-related discharge pattern types at different excitability levels. The number of examined cells in each excitability state is indicated at the top of each column. The activity patterns are color-coded as follows: red indicates an excitatory-simple-synchronized pattern (S+), blue indicates a complex synchronized pattern (Sc), green indicates a suppressive-simple-synchronized pattern (S-), yellow indicates a non-synchronized pattern (NoS) and white indicates null activity (Null). According to the χ2 statistical test: *p<0.05, **p<0.01 and ***p<0.001. Between RMP and H3: χ2 (1, 69) = 18,66, p<0.001; between RMP and H4: χ2 (1, 56) = 14,87; p<0.01. C) Mean firing rates at different excitability levels. Each column corresponds to the mean firing rate ± SEM for an intracellular excitability state. The number of cells examined at each excitability level is indicated at the top of each bar. The Mann-Whitney test was used to perform the statistical analysis: *p<0.05, **p<0.01 and ***p<0.001.
