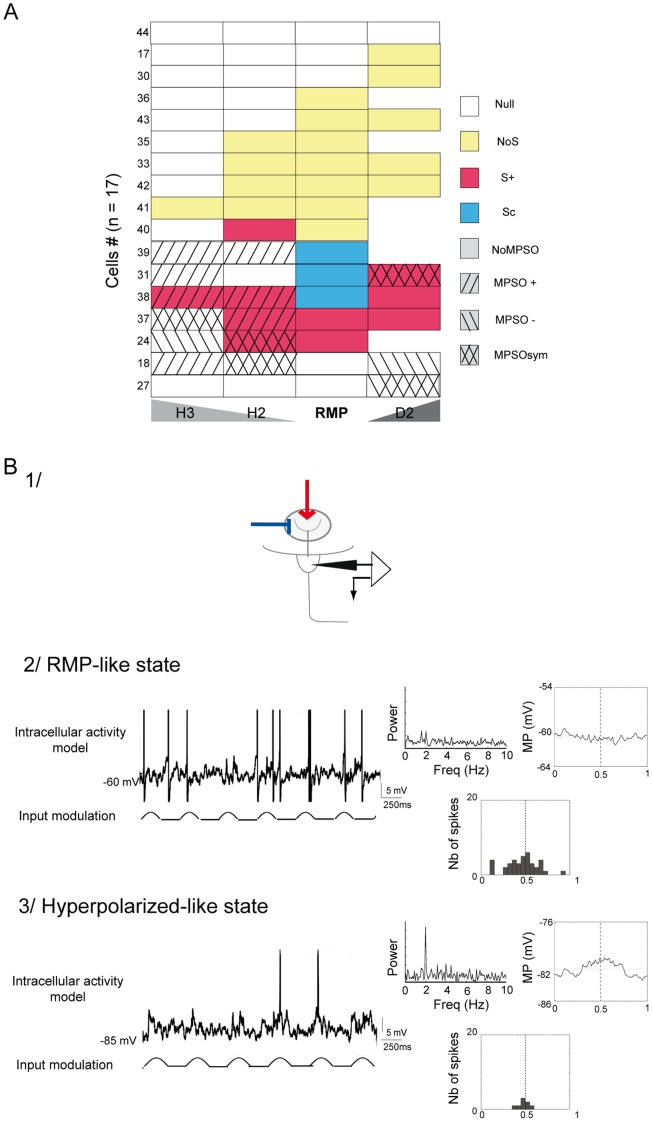
Figure 6. Unmasking of silent membrane potential slow oscillations.
A) A synthetic view of the membrane potential slow oscillations and respiration-related discharge patterns from 17 cells in the H3, H2, RMP and D2 excitability states. Each line corresponds to a single cell. Of these 17 cells, 9 were also examined with odor stimulation and are indicated with the same numbers (between 1 and 36) as those analyzed in Figure 2. The remaining 8 cells were numbered from 37 to 44. Of the 17 cells, 6 were not depolarized. The activity patterns are indicated by color as follows: blue indicates a complex synchronized pattern (Sc), red indicates an excitatory-simple-synchronized pattern (S+), yellow indicates a non-synchronized pattern (NoS) and white represents null activity (Null). The different types of hatch marks represent the presence and types of membrane potential; the right hatch marks indicate positive membrane potential slow oscillations (MPSO+), the left hatch marks indicate negative membrane potential slow oscillations (MPSO-), the cross hatches indicate symmetric membrane potential slow oscillations (MPSOsym) and a lack of hatches indicates cells without oscillations (NoMPSO). B) Computational simulation of intracellular activity with rhythmic inputs at the resting membrane potential (RMP-like state, 2) and during negative current injection (hyperpolarized-like state, 3). 1) Schematic representation of the simulation configuration. The synaptic currents corresponding to a mixture of excitation from olfactory receptor neurons and inhibition from periglomerular cells were injected into the tuft. The simulation parameter details are provided in the Material and Methods section and in Supporting Information S1. 2/Simulated recording of a mitral soma model at the resting membrane potential indicating no intracellular oscillations. 3/Simulated recording of a mitral soma model with an additional negative current. This signal showed an MPSO. In 2 and 3: top-left: intracellular activity simulation; bottom-left: simulated input; top-right: Fourier power spectrum plot of the membrane potential and respiration-triggered membrane potential average; bottom-right: the resulting respiration-triggered histogram of action potentials. The vertical dotted line indicates the inspiration/expiration transition.

