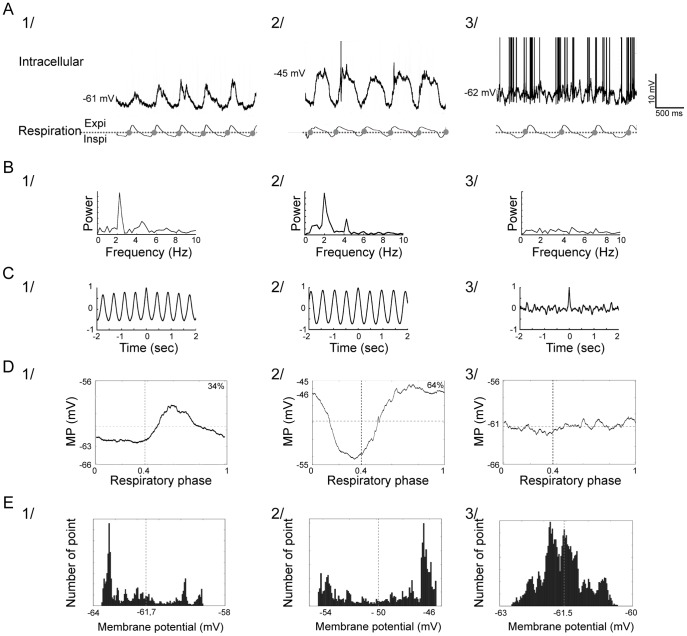
Figure 10. Characterization of membrane potential slow oscillations.
A) Intracellular recordings of 1) a cell with a positive oscillation (MPSO+), 2) a cell with a negative oscillation (MPSO -) and 3) a cell without oscillation (NoMPSO). Top: intracellular signal; bottom: respiratory signal with expiration (Expi) and inspiration (Inspi) separated by a dotted line. The gray circles indicate the inspiration/expiration transitions. The action potentials have been truncated to improve membrane potential visibility. B) Membrane potential Fourier power spectrum analysis. Cells with membrane potential slow oscillations (1 and 2) exhibited a higher power in the 2 Hz frequency range (corresponding to the respiratory rhythm) than a cell without oscillation (3). C) Autocorrelograms of the membrane potential. Cells with oscillations (1 and 2) present an oscillating autocorrelogram, while a cell without oscillation (3) shows a flat autocorrelogram. D) Respiration-triggered membrane potential average. A positive membrane potential slow oscillation was characterized by an up-point proportion <42% (1), whereas a negative oscillation manifested an up-point proportion >58% (2) (please refer to the text for details). In the cells without oscillations, the plots were relatively flat. The inspiration/expiration transition is marked by a vertical dotted line, and the mean membrane potential is represented by a horizontal dotted line. E) Histograms of membrane potential distribution. The mean membrane potential is represented by a vertical dotted line.

