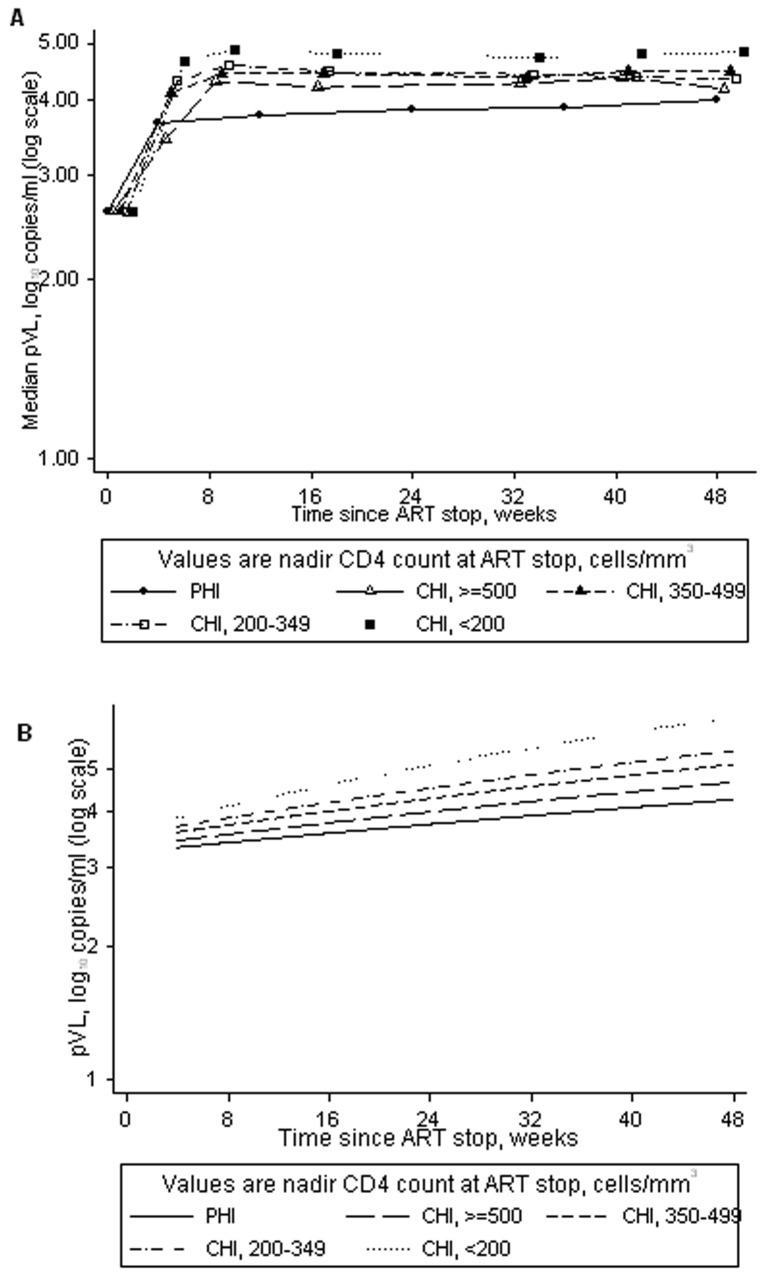
Figure 2. pVL after ART stop in primary (PHI) and chronic HIV infection (CHI), with CHI participants categorised by nadir CD4 count.
a. median (IQR) pVL up to 48 weeks after ART stop. b. predicted pVL over 4–48 weeks after ART stop, based on a representative participant (male infected through sex between men, aged 40 years and CD4 count 600 cells/mm3 at ART stop; values in brackets are the 95% CI). CI = confidence intervals, IQR = interquartile range, pLV = plasma viral load.

