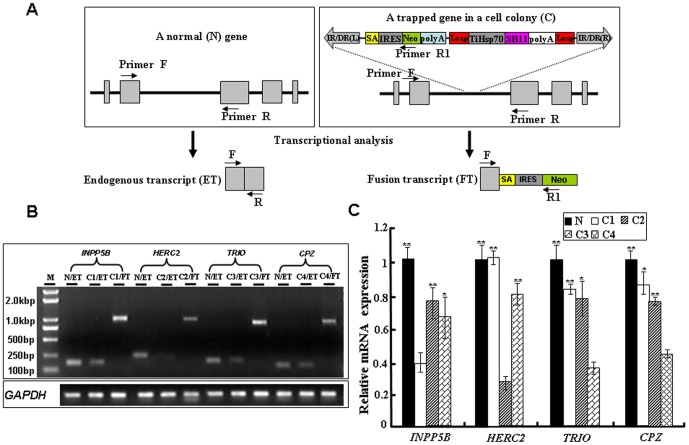
Figure 7. Integration of the SB-based gene trap efficiently disrupts the expression endogenous genes in HeLa cells.
(A) Schematic representation of a gene trapping insertion in an endogenous gene and potential transcripts in Hela cells. Endogenous exons are boxed and arrows indicate the positions of primers used for transcript analysis. IR/DR(L) and IR/DR(R), left and right inverted repeat/directed repeat of the SB transposon; SA, splice acceptor; IRES, internal ribosome entry site; Neo, kanamycin resistance gene; poly(A), poly(A) signal; TiHSP70, tilapia Hsp70 promotor; SB11, SB11 transposase gene. (B) RT-PCR analysis of transcripts from a trapped endogenous gene (INPP5B, HERC2, TRIO or CPZ) in four cell colonies. N: Normal HeLa cells; C: cell colonies; ET: Endogenous transcript; FT: Fusion transcript. The GAPDH is used as the control for equal amount of cDNA template in PCR reactions. (C) Assessing the mutagenicity of gene-trap insertions by qRT-PCR. Total RNA was isolated from each cell colony and subjected to qRT-PCR analysis. The mRNA expression levels of an endogenous gene in the normal Hela cells and two other colonies without insertion at the gene loci (the controls) were compared to that in a cell colony containing an insertion at the corresponding gene loci. N represent normal HeLa cells; C1 represents INPP5B gene; C2 represents HERC2 gene; C3 represents TRIO gene; C4 represents CPZ gene. Data are given as Means ± Standard Deviation (n ≥3). ** and * indicate P<0.01 and P<0.05 versus the controls, respectively.

