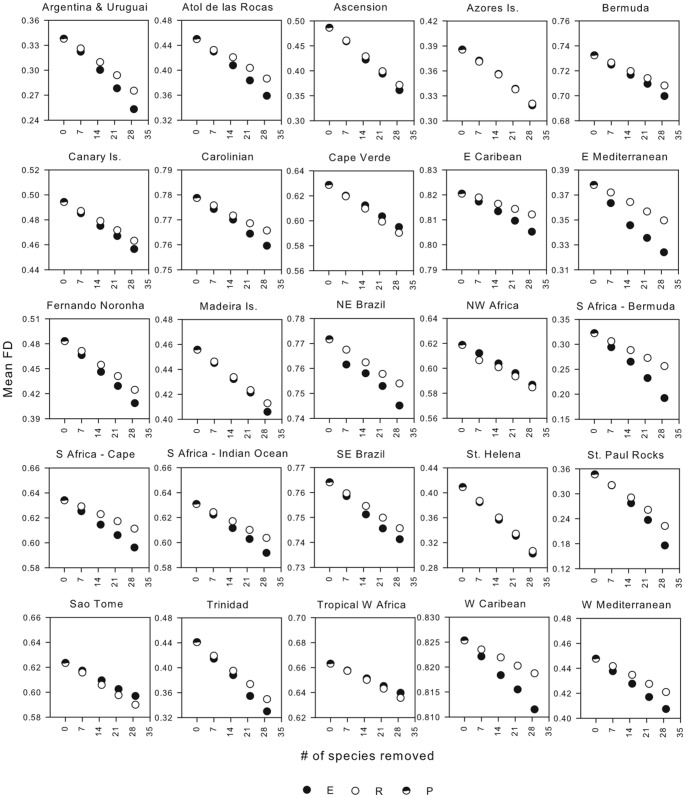
Figure 3. Relationship between functional diversity (FD) and fishing pressure.
Each point represents the mean FD (n = 100 iterations) of communities after removing 7, 15, 22, and 29 species. Species removals were done by either randomly drawing commercially exploited species only (E – filled circles) or at random from the entire species pool (R – open circles). FD of pristine communities (no species removals) is also shown (P – half-filled circles). All regressions were significant at α = 0.05.

