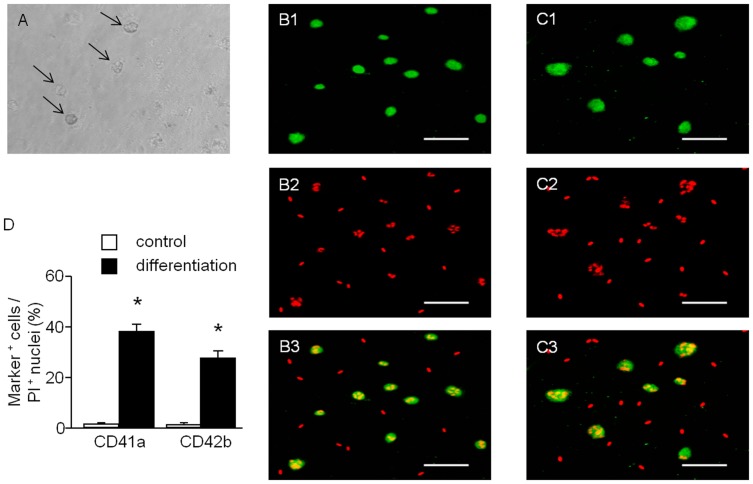
Figure 2. Microscopic analysis of MKs differentiated from hESSCs.
MK differentiation can be observed by cell size under light microscope (A: MKs, indicated by black arrows) and determined by immunocytochemistry staining (B1: CD41a; C1: CD42b; B2, C2: PI; B3, C3: merged. scale bar: 75 µm). D, summarized data showing the expression rates are expressed as mean ± SEM, *P<0.01, control versus differentiation, n = 4/group.

