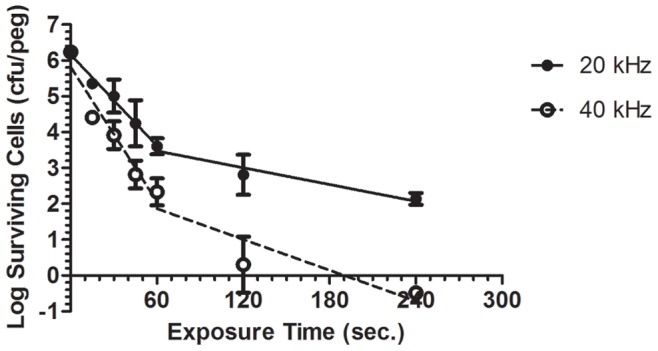
Figure 4. Survival curves of biofilms treated with 20 kHz vs. 40 kHz plasma.

Comparison between log survival curves of P. aeruginosa biofilm cells, constructed as described above, upon exposure to both 20 kHz and 40 kHz plasma jet. (Each point represents the mean of 3 values ± SE).
