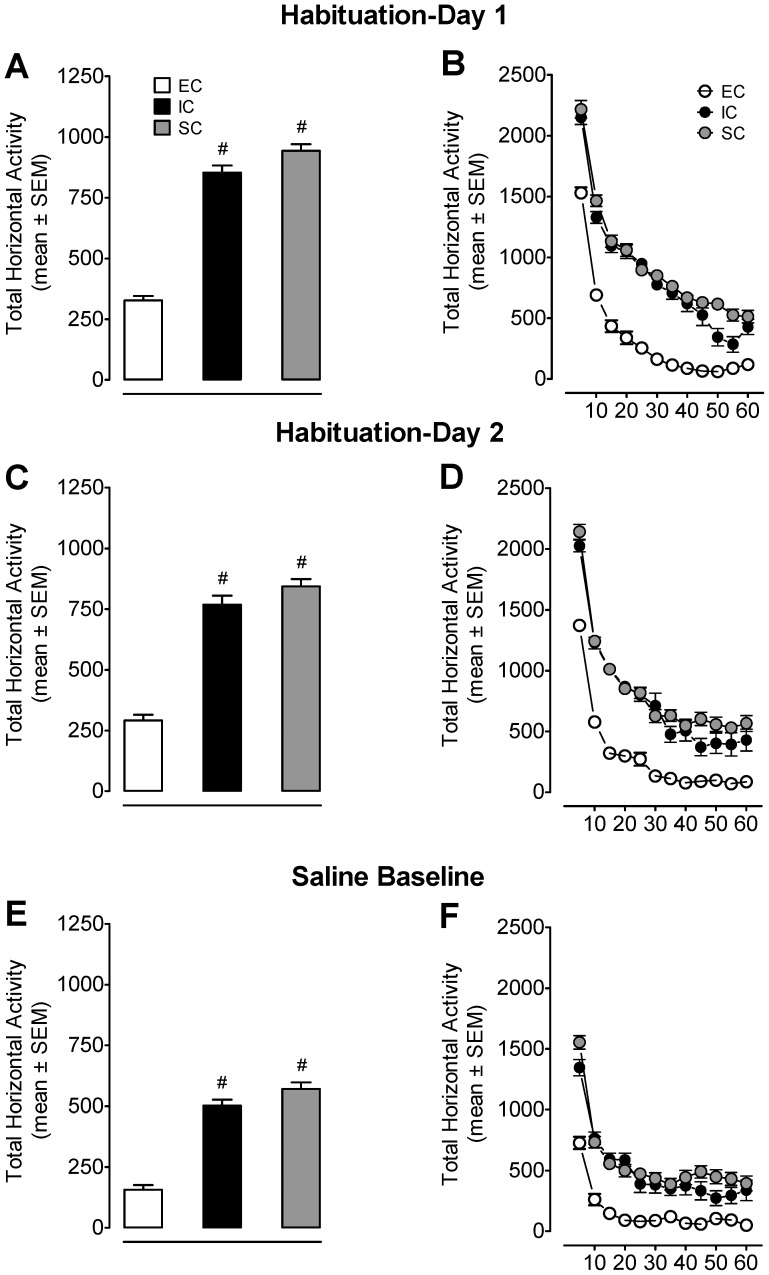
Figure 1. Environmental enrichment diminishes baseline activity during the habituation and saline baseline sessions.
Panels A, C, and E show the total horizontal activity (mean ± SEM) across the two 60-min habituation periods and 60-min session post-saline injection. Panels B, D, and F show the time course of the total horizontal activity (mean ± SEM) during each 5-min interval across the two 60-min habituation periods and 60-min session post saline injection. Total horizontal activity revealed a significant effect of housing condition (F(2, 70) = 46.48, p<0.001), day (F(1, 70) = 317.41, p<0.001) and time (F(11, 770) = 148.57, p<0.001), and a significant housing condition × day × time interaction (F(22, 770) = 2.48, p < 0.001). Overall total horizontal activity was lower in EC than in IC or SC (p<0.001, Bonferroni t-test). # p<0.001 denotes difference between EC and IC or SC groups (n = 22–27 rats/group).

