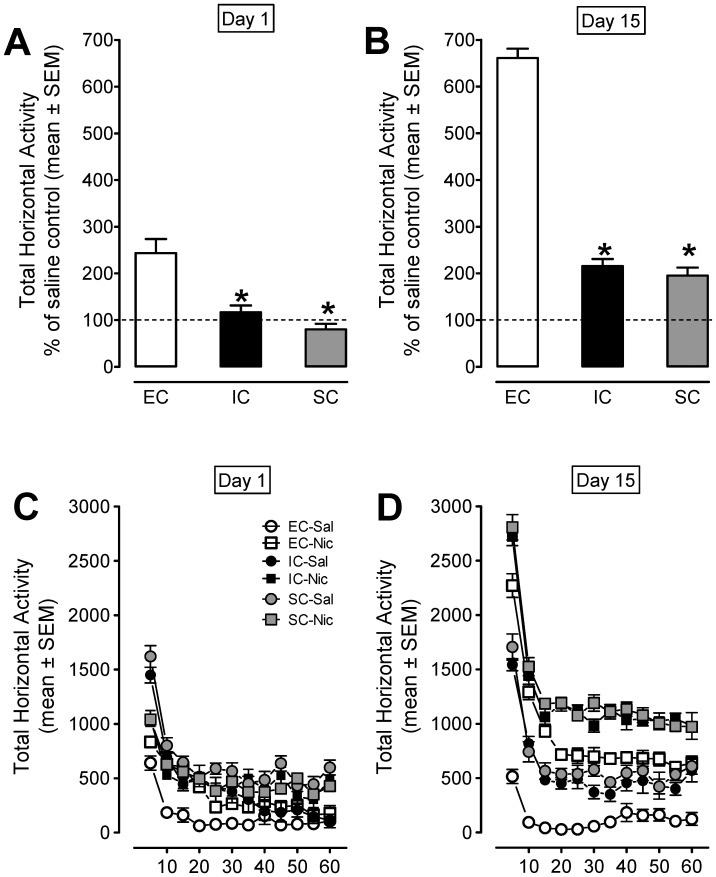
Figure 3. The time-course data for total horizontal activity during day 1 and day 15 of the behavioral sensitization phase.
Panels A and B show the total horizontal activity (mean ± SEM) across the 60-min session. Data are presented as percent of their saline controls for respective housing condition. Panels C and D show the time course of the total horizontal activity (mean ± SEM) during each 5-min interval. * p<0.05 between EC and IC or SC groups. n = 12 rats/group.

