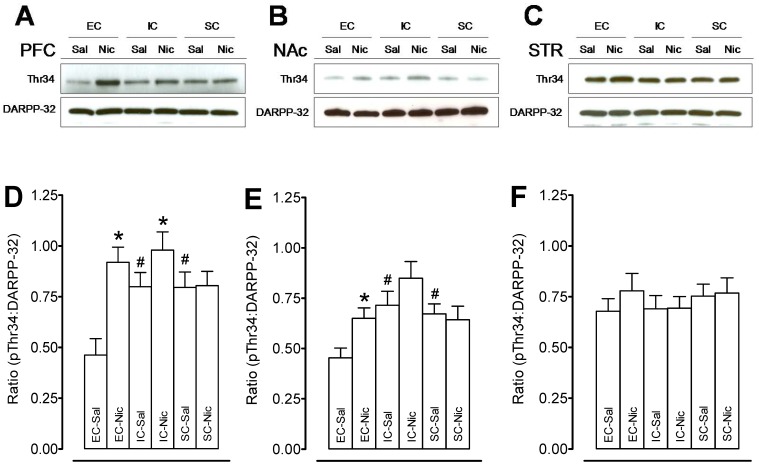
Figure 4. Levels of pDARPP-32 Thr34 and total DARPP-32 in prefrontal cortex, nucleus accumbens and striatum in EC, IC, and SC rats.
Top panels show representative immunoblots of pDARPP-32 Thr34 and total DARPP-32 in prefrontal cortex (PFC, A), nucleus accumbens (NAc, B) and striatum (STR, C) in nicotine or saline-treated rats. Bottom panels show the ratio of levels of pDARPP-32 Thr34 to total DARPP-32 in PFC (D), NAc (E) and STR (F) of nicotine (0.35 mg/kg) or saline-treated rats. Data are presented as the percentage of pDARPP-32 Thr34 to total DARPP32 densitometry values of immunoreactivity. Histobars represent means and bars are SEM. Total DARPP-32 and pDARPP-32 Thr34 were run at the same time with the same loading amount of protein. No statistically significant differences were found with total DARPP-32 levels in any of the groups. *p<0.05 denotes difference between the nicotine- and saline-treated groups. #p<0.05 denotes difference between housing groups. n = 10 rats/group.

