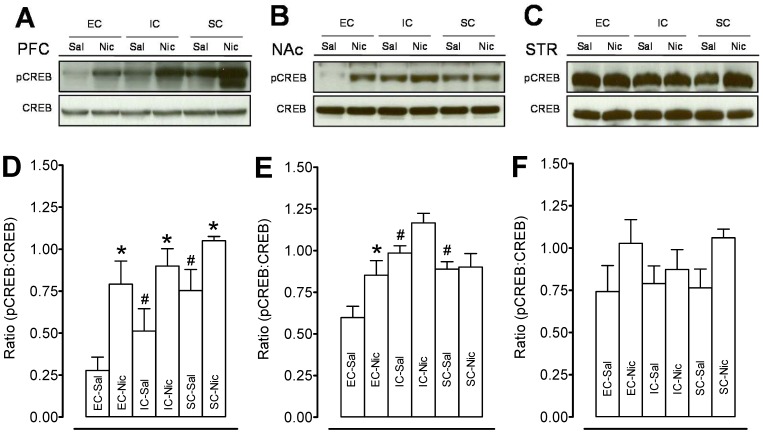
Figure 5. Levels of pCREB and total CREB in prefrontal cortex, nucleus accumbens, and striatum in EC, IC, and SC rats.
Top panels show representative Western blots of pCREB and CREB in prefrontal cortex (PFC, A), nucleus accumbens (NAc, B) and striatum (STR, C). Bottom panels show the ratio of phosphorylated CREB levels to total CREB in PFC (D), NAc (E) and STR (F) of nicotine (0.35 mg/kg) or saline-treated rats. Data are presented as the percentage of pCREB to total CREB densitometry values of immunoreactivity. Histobars represent means and bars are SEM. Total CREB and pCREB were run at the same time with the same loading amount of protein. No statistically significant differences were found with total CREB levels in any of the groups. *p<0.05 denotes difference between the nicotine- and saline-treated groups. #p<0.05 denotes difference between housing groups. n = 10 rats/group.

