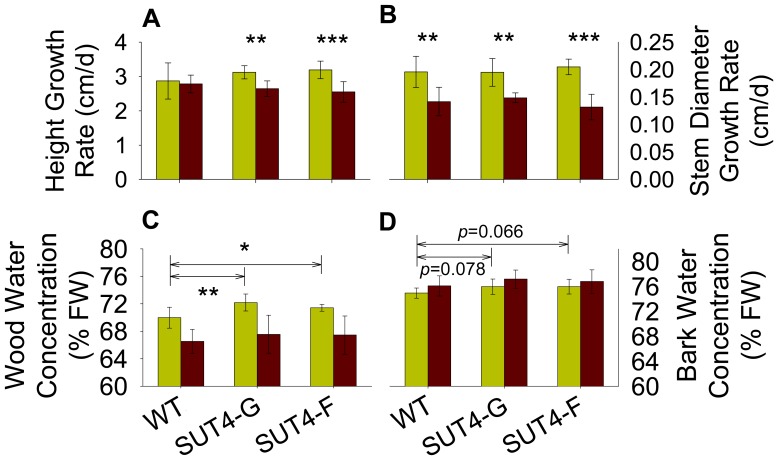
Figure 2. Effects of water availability on Populus stem growth and water concentrations.
(A) height growth rate, (B) stem diameter growth rate, (C) wood water concentrations (g/g×100), and (D) bark water concentration (g/g×100). Light and dark bars represent high and low soil moisture, respectively. For (A) and (B), asterisk denotes statistical significance between high and low soil moisture within a line. For (C) and (D), asterisks and p-values represent pairwise comparisons between high soil moisture groups delineated by the arrows (i.e., wild type vs. one of the transgenic lines). Bars represent means ± SD of 6–8 replicate plants. *p≤0.05, **0.001<p≤0.01, ***p≤0.001 as determined by Student’s t-test.

